HOT TOPICS LIST
- MACD
- Fibonacci
- RSI
- Gann
- ADXR
- Stochastics
- Volume
- Triangles
- Futures
- Cycles
- Volatility
- ZIGZAG
- MESA
- Retracement
- Aroon
INDICATORS LIST
LIST OF TOPICS
PRINT THIS ARTICLE
by Donald W. Pendergast, Jr.
Shares of Baker Hughes have been meandering in a $10 range for the the past six weeks, but that may be about to change, and quickly.
Position: Sell
Donald W. Pendergast, Jr.
Donald W. Pendergast is a financial markets consultant who offers specialized services to stock brokers and high net worth individuals who seek a better bottom line for their portfolios.
PRINT THIS ARTICLE
TRADING SYSTEMS
Baker Hughes And Its Strong Sell Signal
09/22/11 09:26:59 AMby Donald W. Pendergast, Jr.
Shares of Baker Hughes have been meandering in a $10 range for the the past six weeks, but that may be about to change, and quickly.
Position: Sell
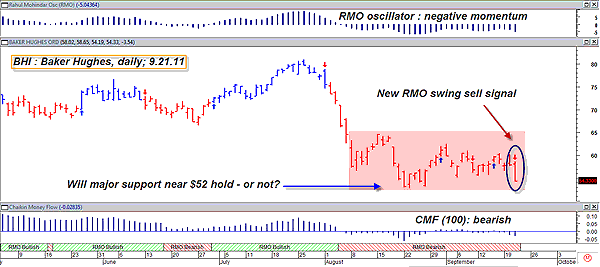
| Boasting a share price of more than $80 by late July 2011, Baker Hughes (BHI) has fallen by nearly $30 per share in just two months. After enduring a six-and-a-half week period of sideways consolidation, the stock is now the recipient of a new Rahul Mohindar oscillator (RMO) swing sell signal, one occurring on wide range and heavy volume. As you see, the stock's price is getting close to the lower end of the range-bound pattern (pink shaded area) so it may be a good time to consider how to latch on to BHI's sudden surge southward. Further, long-term money flow (based on the 100-period Chaikin money flow histogram) is poor (but not horrible) at this point and the stock is also experiencing significant downside momentum (based on the RMO at the top of the page). On the comparative relative strength side of things, BHI is also looking weak, so this could be a good short sale to ponder, especially if the lower end of the pink support area is broken through on (once again) big volume and range. See Figure 1. |

|
| FIGURE 1: BHI, DAILY. When a liquid, large-cap issue flashes a sell signal amid a backdrop of declining momentum and poor money flow, aggressive traders begin to take notice. |
| Graphic provided by: MetaStock. |
| Graphic provided by: RMO indicators and tools from MetaStock 11. |
| |
| Here is one way for aggressive traders to play this short setup. Enter half a position on a drop below Wednesday's low of $54.19 and then place a buy-stop for the same amount of shares (as in, "Buy to cover") above Tuesday's high of $60.20. If $52.69 is taken out soon, add the second half of your short position. Then just manage the trade with a two-bar trailing stop of the daily highs until the final stopout. It's a "dumb as a box of rocks" way to enter, manage, and exit a trade, but so what? It can still help you make some (and keep some) profits on another surge lower while still strictly limiting your risk. Now, that's not such a bad deal now, is it? |
Donald W. Pendergast is a financial markets consultant who offers specialized services to stock brokers and high net worth individuals who seek a better bottom line for their portfolios.
| Title: | Writer, market consultant |
| Company: | Linear Trading Systems LLC |
| Jacksonville, FL 32217 | |
| Phone # for sales: | 904-239-9564 |
| E-mail address: | lineartradingsys@gmail.com |
Traders' Resource Links | |
| Linear Trading Systems LLC has not added any product or service information to TRADERS' RESOURCE. | |
Click here for more information about our publications!
PRINT THIS ARTICLE

Request Information From Our Sponsors
- VectorVest, Inc.
- Executive Premier Workshop
- One-Day Options Course
- OptionsPro
- Retirement Income Workshop
- Sure-Fire Trading Systems (VectorVest, Inc.)
- Trading as a Business Workshop
- VectorVest 7 EOD
- VectorVest 7 RealTime/IntraDay
- VectorVest AutoTester
- VectorVest Educational Services
- VectorVest OnLine
- VectorVest Options Analyzer
- VectorVest ProGraphics v6.0
- VectorVest ProTrader 7
- VectorVest RealTime Derby Tool
- VectorVest Simulator
- VectorVest Variator
- VectorVest Watchdog
- StockCharts.com, Inc.
- Candle Patterns
- Candlestick Charting Explained
- Intermarket Technical Analysis
- John Murphy on Chart Analysis
- John Murphy's Chart Pattern Recognition
- John Murphy's Market Message
- MurphyExplainsMarketAnalysis-Intermarket Analysis
- MurphyExplainsMarketAnalysis-Visual Analysis
- StockCharts.com
- Technical Analysis of the Financial Markets
- The Visual Investor
