HOT TOPICS LIST
- MACD
- Fibonacci
- RSI
- Gann
- ADXR
- Stochastics
- Volume
- Triangles
- Futures
- Cycles
- Volatility
- ZIGZAG
- MESA
- Retracement
- Aroon
INDICATORS LIST
LIST OF TOPICS
PRINT THIS ARTICLE
by Mike Carr, CMT
Recently introduced indexes allow traders to easily spot the changes in sentiment visible in volatility.
Position: Sell
Mike Carr, CMT
Mike Carr, CMT, is a member of the Market Technicians Association, and editor of the MTA's newsletter, Technically Speaking. He is also the author of "Smarter Investing in Any Economy: The Definitive Guide to Relative Strength Investing," and "Conquering the Divide: How to Use Economic Indicators to Catch Stock Market Trends."
PRINT THIS ARTICLE
VOLATILITY
Volatility Shifts Among Markets
09/22/11 09:13:52 AMby Mike Carr, CMT
Recently introduced indexes allow traders to easily spot the changes in sentiment visible in volatility.
Position: Sell
| The CBOE Volatility Index (VIX) has long been followed as a measure of fear in the stock market. This index is calculated by the Chicago Board Options Exchange and shows the amount of volatility in stock index options contracts. Spikes in volatility are usually associated with lows in price and the idea that investor panic drives volatility took hold. |
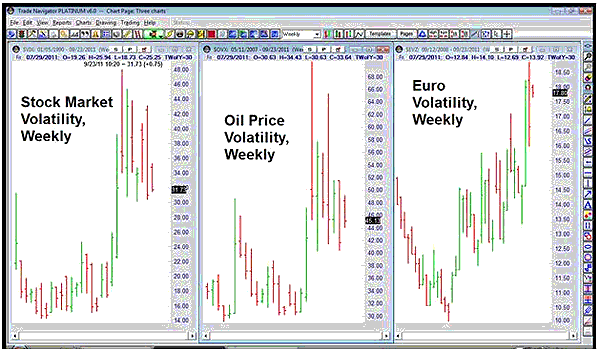
| Recently, indexes for gold, oil, and euro volatility have been added. Weekly charts of the volatility of stocks, oil, and the euro are shown in Figure 1. |

|
| FIGURE 1: COMPARISON. Volatility shows a similar pattern in all three markets. |
| Graphic provided by: Trade Navigator. |
| |
| Over time, markets have become increasingly interlinked and this is seen in volatility as much as in price. Over the summer, oil and stocks fell sharply and volatility rose just as sharply. We can see that volatility (at least based on the ranges of the weekly bars of the respective volatility indexes) has declined more in oil than stocks and the price of oil has been basing in recent weeks. Stocks still seem to be moving sharply higher and lower on alternating days. In both markets, volatility remains well above the levels seen earlier in the year. |
| The euro shows a different picture. Volatility continues rising as the crisis in Europe unfolds. The currency has been relatively strong, but with rising volatility, it is unlikely a bottom is in place. |
| Currencies may be a challenging market as some believe global economies face increasing challenges. However, until volatility starts falling, the euro looks like it is a better short trade than most currencies. |
Mike Carr, CMT, is a member of the Market Technicians Association, and editor of the MTA's newsletter, Technically Speaking. He is also the author of "Smarter Investing in Any Economy: The Definitive Guide to Relative Strength Investing," and "Conquering the Divide: How to Use Economic Indicators to Catch Stock Market Trends."
| Website: | www.moneynews.com/blogs/MichaelCarr/id-73 |
| E-mail address: | marketstrategist@gmail.com |
Click here for more information about our publications!
PRINT THIS ARTICLE

|

Request Information From Our Sponsors
- StockCharts.com, Inc.
- Candle Patterns
- Candlestick Charting Explained
- Intermarket Technical Analysis
- John Murphy on Chart Analysis
- John Murphy's Chart Pattern Recognition
- John Murphy's Market Message
- MurphyExplainsMarketAnalysis-Intermarket Analysis
- MurphyExplainsMarketAnalysis-Visual Analysis
- StockCharts.com
- Technical Analysis of the Financial Markets
- The Visual Investor
- VectorVest, Inc.
- Executive Premier Workshop
- One-Day Options Course
- OptionsPro
- Retirement Income Workshop
- Sure-Fire Trading Systems (VectorVest, Inc.)
- Trading as a Business Workshop
- VectorVest 7 EOD
- VectorVest 7 RealTime/IntraDay
- VectorVest AutoTester
- VectorVest Educational Services
- VectorVest OnLine
- VectorVest Options Analyzer
- VectorVest ProGraphics v6.0
- VectorVest ProTrader 7
- VectorVest RealTime Derby Tool
- VectorVest Simulator
- VectorVest Variator
- VectorVest Watchdog
