HOT TOPICS LIST
- MACD
- Fibonacci
- RSI
- Gann
- ADXR
- Stochastics
- Volume
- Triangles
- Futures
- Cycles
- Volatility
- ZIGZAG
- MESA
- Retracement
- Aroon
INDICATORS LIST
LIST OF TOPICS
PRINT THIS ARTICLE
by Matt Blackman
While "The Oracle of Omaha" has been in the headliines, the other Oracle has been gaining ground.
Position: N/A
Matt Blackman
Matt Blackman is a full-time technical and financial writer and trader. He produces corporate and financial newsletters, and assists clients in getting published in the mainstream media. He is the host of TradeSystemGuru.com. Matt has earned the Chartered Market Technician (CMT) designation. Find out what stocks and futures Matt is watching on Twitter at www.twitter.com/RatioTrade
PRINT THIS ARTICLE
HEAD & SHOULDERS
Is Oracle Trying to Tell Us Something?
09/21/11 09:40:24 AMby Matt Blackman
While "The Oracle of Omaha" has been in the headliines, the other Oracle has been gaining ground.
Position: N/A
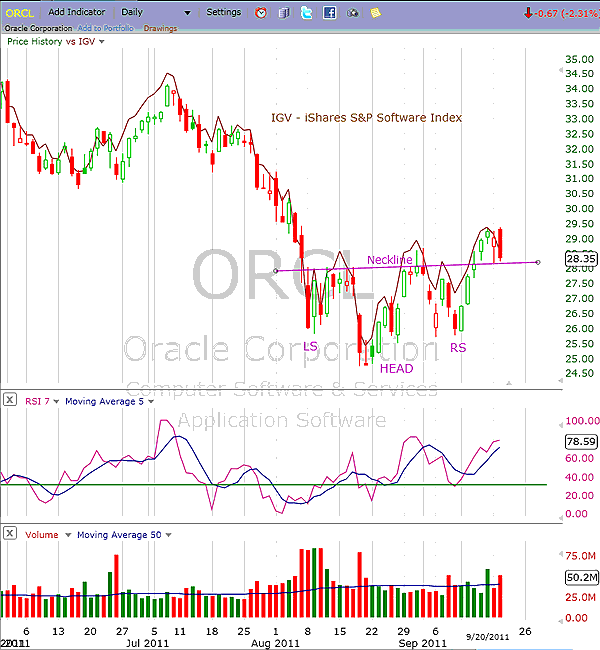
| Sotheby's (BID) may have failed to confirm its inverted head & shoulders pattern this week (see my Traders.com Advantage article, "BID On A Bullish Head & Shoulders?"), but not so with Oracle (ORCL) (Figure 1). It decisively broke above neckline resistance on September 15 and even with weakness on September 19 and 20, it has remained above neckline support. |

|
| FIGURE 1: ORCL, DAILY. This chart of Oracle shows that it has so far been able to hold above the inverted head & shoulders neckline and in the process outperform the iShares S&P GTSI Software Index (IGV). |
| Graphic provided by: FreeStockCharts.com. |
| |
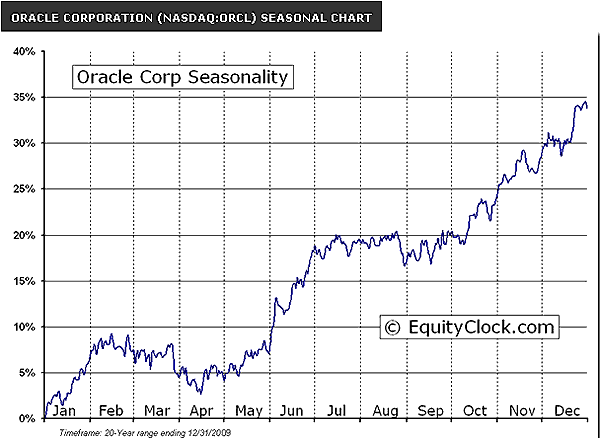
| On September 20, Oracle reported earnings per share of $0.48, topping analysts' estimates by a penny per share, which helped propel the price higher in after-hours trading. As Figure 2 shows, Oracle has a habit of putting in a strong finish to the year, based on its seasonal chart showing a composite from 1989 to 2009. |

|
| FIGURE 2: ORCL. This seasonal chart of Oracle shows the late-year rally that has occurred over the last 20 years. |
| Graphic provided by: www.EquityClock.com. |
| |
| But overall, stocks have continued their manic ways since the early August lows, creating confusion all around. Dow Jones transports, a normal leader in a rally, have been weak while Dow Jones utilities, which act as a safe haven and tend to lead in the late stages of a stock rally, have been outperforming. |
| Equally confusing is the fact that copper, a good indicator of economic growth, has been hitting new mid-term lows. Declining copper prices are due at least in part to slowing in China but given that nation's habit of consistent 10% growth, weakness in the Shanghai Shenzen Composite Index (SSEC-X) is also troubling. |
| Bulls have been hoping that the weakness that normally hits in September was moved forward to August this year and await the start of the late-year rally that usually arrives in the fourth quarter of the preelection year. But anyone who is watching a number of sectors and other markets must be wondering if the Halloween trolls may still have some more nasty surprises in store for investors. |
Matt Blackman is a full-time technical and financial writer and trader. He produces corporate and financial newsletters, and assists clients in getting published in the mainstream media. He is the host of TradeSystemGuru.com. Matt has earned the Chartered Market Technician (CMT) designation. Find out what stocks and futures Matt is watching on Twitter at www.twitter.com/RatioTrade
| Company: | TradeSystemGuru.com |
| Address: | Box 2589 |
| Garibaldi Highlands, BC Canada | |
| Phone # for sales: | 604-898-9069 |
| Fax: | 604-898-9069 |
| Website: | www.tradesystemguru.com |
| E-mail address: | indextradermb@gmail.com |
Traders' Resource Links | |
| TradeSystemGuru.com has not added any product or service information to TRADERS' RESOURCE. | |
Click here for more information about our publications!
PRINT THIS ARTICLE

Request Information From Our Sponsors
- VectorVest, Inc.
- Executive Premier Workshop
- One-Day Options Course
- OptionsPro
- Retirement Income Workshop
- Sure-Fire Trading Systems (VectorVest, Inc.)
- Trading as a Business Workshop
- VectorVest 7 EOD
- VectorVest 7 RealTime/IntraDay
- VectorVest AutoTester
- VectorVest Educational Services
- VectorVest OnLine
- VectorVest Options Analyzer
- VectorVest ProGraphics v6.0
- VectorVest ProTrader 7
- VectorVest RealTime Derby Tool
- VectorVest Simulator
- VectorVest Variator
- VectorVest Watchdog
- StockCharts.com, Inc.
- Candle Patterns
- Candlestick Charting Explained
- Intermarket Technical Analysis
- John Murphy on Chart Analysis
- John Murphy's Chart Pattern Recognition
- John Murphy's Market Message
- MurphyExplainsMarketAnalysis-Intermarket Analysis
- MurphyExplainsMarketAnalysis-Visual Analysis
- StockCharts.com
- Technical Analysis of the Financial Markets
- The Visual Investor
