HOT TOPICS LIST
- MACD
- Fibonacci
- RSI
- Gann
- ADXR
- Stochastics
- Volume
- Triangles
- Futures
- Cycles
- Volatility
- ZIGZAG
- MESA
- Retracement
- Aroon
INDICATORS LIST
LIST OF TOPICS
PRINT THIS ARTICLE
by Andrew Hetherington
Recognizing a cup and handle formation can be a difficult task. Here are some steps for identifying cup and handle and rounding bottom patterns.
Position: N/A
Andrew Hetherington
Classic Dow Theorist who trades as a pure technician, using pattern recognition.
PRINT THIS ARTICLE
ROUND TOP & BOTTOM
Micro Cap UTS Energy Corporation on the Rise
04/16/02 11:06:26 AMby Andrew Hetherington
Recognizing a cup and handle formation can be a difficult task. Here are some steps for identifying cup and handle and rounding bottom patterns.
Position: N/A
| Every now and again you find a bowl, saucer or a cup and handle formation. Some prefer to call them rounding bottoms. All of these choices are correct. Don't be fooled by these tricky patterns. This particular pattern is one of the most difficult to detect and is therefore one of the most commonly missed. They are a reversal pattern, which leads many to believe jumping in is a good idea. |
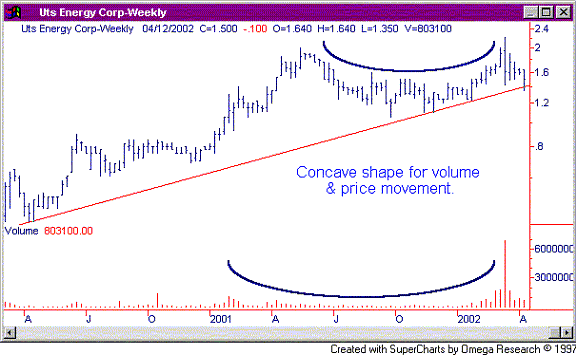
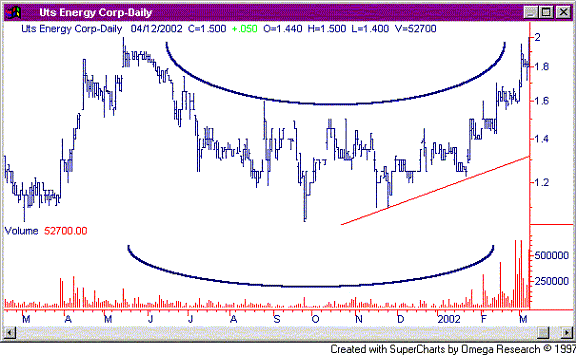
| Anyone trading these patterns should be cautious and look for perfect volume formation. The key to this pattern is in the volume side of the puzzle. The volume must be concave and the price must follow the volume. Pay close attention to any suspicious volume spikes. This is common and prices usually drop back a little before resuming the inevitable uptrend. |

|
| Figure 1: Weekly chart for UTS Energy Corporation (UTS-T). |
| Graphic provided by: SuperCharts. |
| |
 Figure 2: Daily chart for UTS-T through March of 2002, highlighting the rounding bottom (cup) formation. On the weekly and daily charts we see the 9-month concave shaped volume and price movement for this Toronto equity. Many bowls or saucers become cups with handles after the breakout. This consolidation area is common. On the weekly chart we see the long-term trendline in the $1.40 area. This trendline would be the optimum time to buy a long position. The anticipated upward move to come has limited downside potential. If the long-term trend line breaks you should have a stop loss just underneath to protect your position. The anticipated up move will require patience but should prove to be rewarding. |
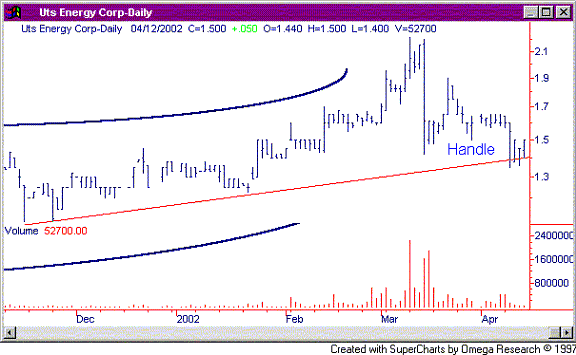
 Figure 3: Daily chart for UTS-T extending into April of 2002, highlighting the cup and handle formation. |
Classic Dow Theorist who trades as a pure technician, using pattern recognition.
| Toronto, Canada |
Click here for more information about our publications!
Comments
Date: 04/16/02Rank: 3Comment:

Request Information From Our Sponsors
- VectorVest, Inc.
- Executive Premier Workshop
- One-Day Options Course
- OptionsPro
- Retirement Income Workshop
- Sure-Fire Trading Systems (VectorVest, Inc.)
- Trading as a Business Workshop
- VectorVest 7 EOD
- VectorVest 7 RealTime/IntraDay
- VectorVest AutoTester
- VectorVest Educational Services
- VectorVest OnLine
- VectorVest Options Analyzer
- VectorVest ProGraphics v6.0
- VectorVest ProTrader 7
- VectorVest RealTime Derby Tool
- VectorVest Simulator
- VectorVest Variator
- VectorVest Watchdog
- StockCharts.com, Inc.
- Candle Patterns
- Candlestick Charting Explained
- Intermarket Technical Analysis
- John Murphy on Chart Analysis
- John Murphy's Chart Pattern Recognition
- John Murphy's Market Message
- MurphyExplainsMarketAnalysis-Intermarket Analysis
- MurphyExplainsMarketAnalysis-Visual Analysis
- StockCharts.com
- Technical Analysis of the Financial Markets
- The Visual Investor
