HOT TOPICS LIST
- MACD
- Fibonacci
- RSI
- Gann
- ADXR
- Stochastics
- Volume
- Triangles
- Futures
- Cycles
- Volatility
- ZIGZAG
- MESA
- Retracement
- Aroon
INDICATORS LIST
LIST OF TOPICS
PRINT THIS ARTICLE
by Mike Carr, CMT
Former high-flier Netflix fell sharply. Looking at the chart in hindsight, troubling signs were evident, and there are lessons we can apply in the future.
Position: Sell
Mike Carr, CMT
Mike Carr, CMT, is a member of the Market Technicians Association, and editor of the MTA's newsletter, Technically Speaking. He is also the author of "Smarter Investing in Any Economy: The Definitive Guide to Relative Strength Investing," and "Conquering the Divide: How to Use Economic Indicators to Catch Stock Market Trends."
PRINT THIS ARTICLE
RATE OF CHANGE
Learning From Netflix
09/19/11 09:15:48 AMby Mike Carr, CMT
Former high-flier Netflix fell sharply. Looking at the chart in hindsight, troubling signs were evident, and there are lessons we can apply in the future.
Position: Sell
| William O'Neil spent many hours studying the charts of the biggest stock market winners in history. From his analysis, he was able to highlight the key characteristics to look for in future winners. He created the CANSLIM system, which is still used by many traders to spot potential winners. Even in the age of high-frequency trading, looking at charts for lessons learned can still be valuable. |
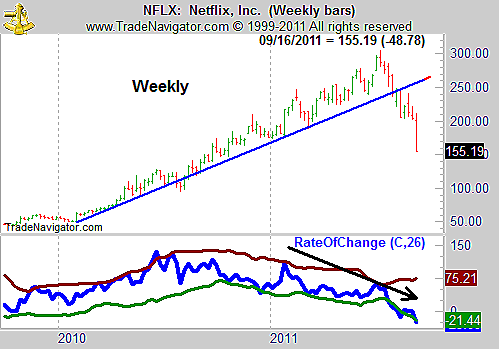
| Netflix was one of the biggest stock market losers in the past week. The company recently changed its business model and consumers changed their buying habits in response. Investors also seemed to change their opinion of the stock suddenly, and the result can be seen in the chart. The weekly chart is shown in Figure 1. |

|
| FIGURE 1: NFLX, WEEKLY. Netflix had several sell signals on the weekly chart. |
| Graphic provided by: Trade Navigator. |
| |
| Rate of change is shown as a momentum indicator. It has been diverging from price throughout 2011. NFLX also broke a longstanding trendline that had been touched numerous times. None of this would indicate that NFLX was a short, but it would support closing a long position. After the trendline break, there was really no technical reason to buy. |
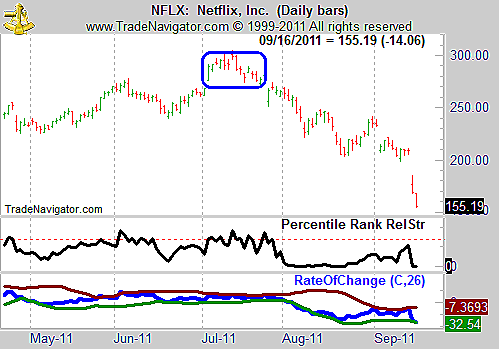
| The daily chart (Figure 2) is also bearish. The blue rectangle in the chart highlights an island top pattern, which is where a high is set off by gaps. In the center of the chart is a calculation of the RS rank similar to the one published by "Investor's Business Daily," the financial newspaper that William O'Neil founded. This rank includes all stocks and futures, so it does not match the IBD measure. It remained below 80, the level O'Neil identified for buys, throughout August. ROC shows the contraction in volatility and since volatility is cyclical, an increase in volatility should be expected. The weight of the evidence indicated that the breakout would probably be bearish. |

|
| FIGURE 2: NFLX, DAILY. Netflix completed an island reversal topping pattern and has fallen sharply since then. |
| Graphic provided by: Trade Navigator. |
| |
| The daily chart also shows that the stock was in a confirmed downtrend with lower lows and lower highs since forming that top. NFLX may have been a very hot stock since the bull market began in March 2009 but gave definite sell signals before crashing. This is usually easy to spot in hindsight, but it is also visible in real time. Trendline breaks, poor relative strength, contacting volatility, and a bearish chart pattern were all visible in this chart, and stocks with these characteristics should be sold. That seems obvious, but someone was holding NFLX as it gapped down. |
Mike Carr, CMT, is a member of the Market Technicians Association, and editor of the MTA's newsletter, Technically Speaking. He is also the author of "Smarter Investing in Any Economy: The Definitive Guide to Relative Strength Investing," and "Conquering the Divide: How to Use Economic Indicators to Catch Stock Market Trends."
| Website: | www.moneynews.com/blogs/MichaelCarr/id-73 |
| E-mail address: | marketstrategist@gmail.com |
Click here for more information about our publications!
PRINT THIS ARTICLE

Request Information From Our Sponsors
- StockCharts.com, Inc.
- Candle Patterns
- Candlestick Charting Explained
- Intermarket Technical Analysis
- John Murphy on Chart Analysis
- John Murphy's Chart Pattern Recognition
- John Murphy's Market Message
- MurphyExplainsMarketAnalysis-Intermarket Analysis
- MurphyExplainsMarketAnalysis-Visual Analysis
- StockCharts.com
- Technical Analysis of the Financial Markets
- The Visual Investor
- VectorVest, Inc.
- Executive Premier Workshop
- One-Day Options Course
- OptionsPro
- Retirement Income Workshop
- Sure-Fire Trading Systems (VectorVest, Inc.)
- Trading as a Business Workshop
- VectorVest 7 EOD
- VectorVest 7 RealTime/IntraDay
- VectorVest AutoTester
- VectorVest Educational Services
- VectorVest OnLine
- VectorVest Options Analyzer
- VectorVest ProGraphics v6.0
- VectorVest ProTrader 7
- VectorVest RealTime Derby Tool
- VectorVest Simulator
- VectorVest Variator
- VectorVest Watchdog
