HOT TOPICS LIST
- MACD
- Fibonacci
- RSI
- Gann
- ADXR
- Stochastics
- Volume
- Triangles
- Futures
- Cycles
- Volatility
- ZIGZAG
- MESA
- Retracement
- Aroon
INDICATORS LIST
LIST OF TOPICS
PRINT THIS ARTICLE
by Koos van der Merwe
Sometimes a stock that is barely known because its price is too low presents a solid buying opportunity.
Position: Buy
Koos van der Merwe
Has been a technical analyst since 1969, and has worked as a futures and options trader with First Financial Futures in Johannesburg, South Africa.
PRINT THIS ARTICLE
ELLIOTT WAVE
Kepple Corp. A Keeper?
09/20/11 10:13:44 AMby Koos van der Merwe
Sometimes a stock that is barely known because its price is too low presents a solid buying opportunity.
Position: Buy
| Kepple Corp. is rarely mentioned by any analysts. Net profit decreased from $4.710 billion in the first half of 2010 to $4.575 billion by the first half of 2011. Net profit, on the other hand, increased from $651 million to $696 million. |

|
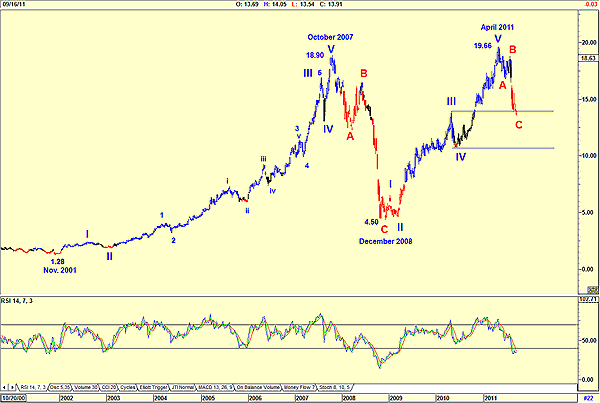
| FIGURE 1: KEPPLE, WEEKLY |
| Graphic provided by: AdvancedGET. |
| |
| Figure 1, a weekly chart, shows how the share price moved from a low of $1.28 on November 2001 to a high of $18.90 by October 2007. The price then dropped to a low of $4.50 by December 2008 along with the general market decline. Since then, it has risen to $19.66 by April 2011. The Elliott wave count over this period is suggesting that an ABC correction has been completed, with the relative strength index (RSI) at oversold levels, but have not given a buy signal yet. The ABC correction is within the fourth wave of lesser degree as shown, so there could be an upward correction soon. |

|
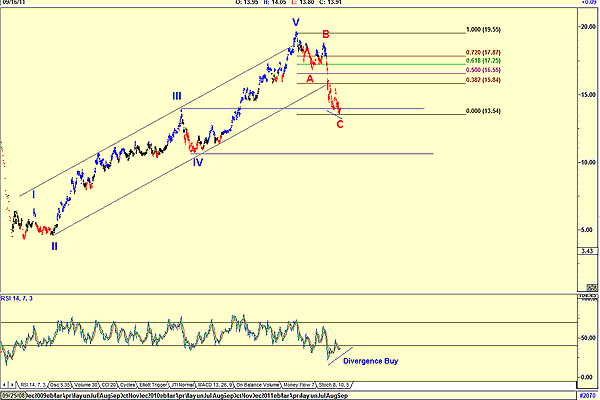
| FIGURE 2: KEPPLE, DAILY |
| Graphic provided by: AdvancedGET. |
| |
| The daily chart shown in Figure 2 is suggesting a divergence buy signal shown by the RSI, with the price within the fourth wave of lesser degree. Fibonacci retracement is suggesting a target of $15.84 (38.2%), $16.55 (50%), and $17.25 (61.8%). This level could be a wave 1 of a new bull trend. With so many bears out there calling for a coming recession, here is another chart suggesting just the opposite. I would be a buyer of Kepple for the long term. |
Has been a technical analyst since 1969, and has worked as a futures and options trader with First Financial Futures in Johannesburg, South Africa.
| Address: | 3256 West 24th Ave |
| Vancouver, BC | |
| Phone # for sales: | 6042634214 |
| E-mail address: | petroosp@gmail.com |
Click here for more information about our publications!
PRINT THIS ARTICLE

Request Information From Our Sponsors
- StockCharts.com, Inc.
- Candle Patterns
- Candlestick Charting Explained
- Intermarket Technical Analysis
- John Murphy on Chart Analysis
- John Murphy's Chart Pattern Recognition
- John Murphy's Market Message
- MurphyExplainsMarketAnalysis-Intermarket Analysis
- MurphyExplainsMarketAnalysis-Visual Analysis
- StockCharts.com
- Technical Analysis of the Financial Markets
- The Visual Investor
- VectorVest, Inc.
- Executive Premier Workshop
- One-Day Options Course
- OptionsPro
- Retirement Income Workshop
- Sure-Fire Trading Systems (VectorVest, Inc.)
- Trading as a Business Workshop
- VectorVest 7 EOD
- VectorVest 7 RealTime/IntraDay
- VectorVest AutoTester
- VectorVest Educational Services
- VectorVest OnLine
- VectorVest Options Analyzer
- VectorVest ProGraphics v6.0
- VectorVest ProTrader 7
- VectorVest RealTime Derby Tool
- VectorVest Simulator
- VectorVest Variator
- VectorVest Watchdog
