HOT TOPICS LIST
- MACD
- Fibonacci
- RSI
- Gann
- ADXR
- Stochastics
- Volume
- Triangles
- Futures
- Cycles
- Volatility
- ZIGZAG
- MESA
- Retracement
- Aroon
INDICATORS LIST
LIST OF TOPICS
PRINT THIS ARTICLE
by Matt Blackman
This is a first, certainly for Sotheby's.
Position: N/A
Matt Blackman
Matt Blackman is a full-time technical and financial writer and trader. He produces corporate and financial newsletters, and assists clients in getting published in the mainstream media. He is the host of TradeSystemGuru.com. Matt has earned the Chartered Market Technician (CMT) designation. Find out what stocks and futures Matt is watching on Twitter at www.twitter.com/RatioTrade
PRINT THIS ARTICLE
HEAD & SHOULDERS
BID On A Bullish Head & Shoulders?
09/19/11 08:56:32 AMby Matt Blackman
This is a first, certainly for Sotheby's.
Position: N/A
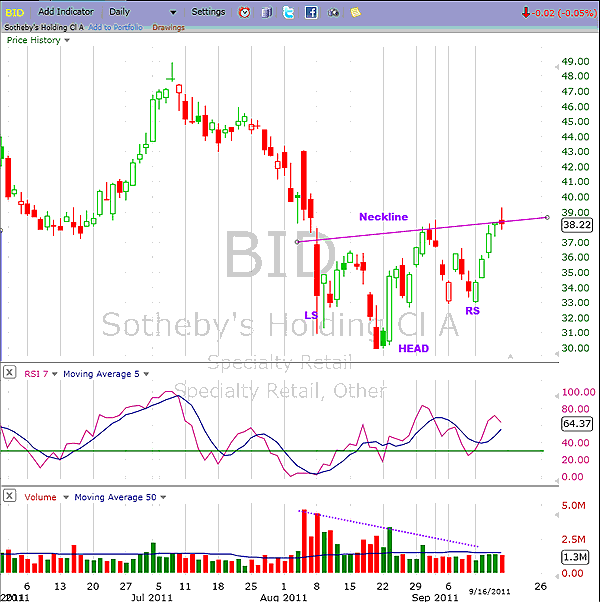
| In my latest Working-Money.com article, "Could One Stock Provide A Reliable Bubble Meter?" (http://goo.gl/25yHx) I discussed the value of Sotheby's (BID) as a bubble indicator due to its habit of peaking and dropping strongly ahead of major indexes. It was therefore interesting to see it flashing a potential bullish inverse head & shoulders pattern recently. After rallying for four consecutive days, it closed right on neckline resistance and except for the fact that it needed to break resistance on convincing volume to be confirmed, this pattern appears to be almost classic textbook. See Figure 1. |

|
| FIGURE 1: BID, DAILY. Here's the chart of Sotheby’s showing the potential inverse head & shoulders pattern near full completion with a classic volume pattern to match -- high volume on the creation of the left shoulder with lower volume at the head. |
| Graphic provided by: FreeStockCharts.com. |
| |
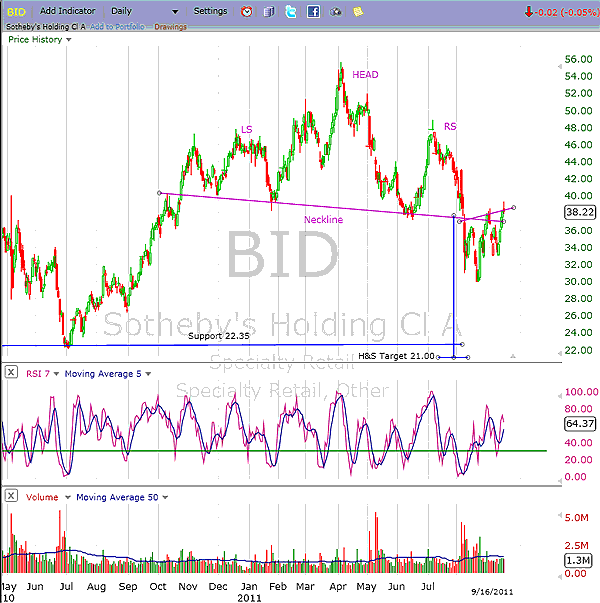
| However, when you step back and look at the longer-term chart, you see another much larger bearish head & shoulders pattern (see Figure 2) that has yet to hit its minimum projected target. |

|
| FIGURE 2: BID, DAILY. Here's the longer-term screenshot of Sotheby’s daily chart showing the much bigger bearish head & shoulders pattern that has yet to read its minimum pattern target as well as the recent inverse H&S. Volume, however, on the larger pattern is atypical; it should be higher on the left shoulder breakout with a lower spike when building the head. However, a large jump in downside volume with the break of the neckline following the right shoulder is typical. |
| Graphic provided by: FreeStockCharts.com. |
| |
| If the most recent bullish H&S pattern is confirmed by a 3% upside breakout on rising volume, it will invalidate its much larger bearish cousin. I can't remember seeing two back-to-back patterns in the opposite direction before, let alone a chart in which the confirmation of one H&S would invalidate the other. But as trader Dan Zanger has opined, the failure of a pattern can often be a signal to trade in the opposite direction. |
| Patience is not just a virtue when it comes to trading; it is essential, so we will have to wait for confirmation on the latest pattern. |
| Either way, this is an important juncture for BID and the rest of the market. Confirmation of the latest H&S pattern would be very bullish, and a failure and breakdown would be equally bearish. |
Matt Blackman is a full-time technical and financial writer and trader. He produces corporate and financial newsletters, and assists clients in getting published in the mainstream media. He is the host of TradeSystemGuru.com. Matt has earned the Chartered Market Technician (CMT) designation. Find out what stocks and futures Matt is watching on Twitter at www.twitter.com/RatioTrade
| Company: | TradeSystemGuru.com |
| Address: | Box 2589 |
| Garibaldi Highlands, BC Canada | |
| Phone # for sales: | 604-898-9069 |
| Fax: | 604-898-9069 |
| Website: | www.tradesystemguru.com |
| E-mail address: | indextradermb@gmail.com |
Traders' Resource Links | |
| TradeSystemGuru.com has not added any product or service information to TRADERS' RESOURCE. | |
Click here for more information about our publications!
PRINT THIS ARTICLE

|

Request Information From Our Sponsors
- StockCharts.com, Inc.
- Candle Patterns
- Candlestick Charting Explained
- Intermarket Technical Analysis
- John Murphy on Chart Analysis
- John Murphy's Chart Pattern Recognition
- John Murphy's Market Message
- MurphyExplainsMarketAnalysis-Intermarket Analysis
- MurphyExplainsMarketAnalysis-Visual Analysis
- StockCharts.com
- Technical Analysis of the Financial Markets
- The Visual Investor
- VectorVest, Inc.
- Executive Premier Workshop
- One-Day Options Course
- OptionsPro
- Retirement Income Workshop
- Sure-Fire Trading Systems (VectorVest, Inc.)
- Trading as a Business Workshop
- VectorVest 7 EOD
- VectorVest 7 RealTime/IntraDay
- VectorVest AutoTester
- VectorVest Educational Services
- VectorVest OnLine
- VectorVest Options Analyzer
- VectorVest ProGraphics v6.0
- VectorVest ProTrader 7
- VectorVest RealTime Derby Tool
- VectorVest Simulator
- VectorVest Variator
- VectorVest Watchdog
