HOT TOPICS LIST
- MACD
- Fibonacci
- RSI
- Gann
- ADXR
- Stochastics
- Volume
- Triangles
- Futures
- Cycles
- Volatility
- ZIGZAG
- MESA
- Retracement
- Aroon
INDICATORS LIST
LIST OF TOPICS
PRINT THIS ARTICLE
by Billy Williams
In trading, knowing the difference between being an interpreter and a predictor can translate into huge results when looking for profitable trades.
Position: Hold
Billy Williams
Billy Williams has been trading the markets for 27 years, specializing in momentum trading with stocks and options.
PRINT THIS ARTICLE
PRICE/VOLUME TREND
The State Of Price Action In The Market
09/16/11 12:38:21 PMby Billy Williams
In trading, knowing the difference between being an interpreter and a predictor can translate into huge results when looking for profitable trades.
Position: Hold
| The current state of the market suggests that it is trying to rally, but both price and volume still find themselves weighed down by negative news as well as being mired in the potential trouble of Europe. But you have to trade the market based on what it's telling you through close scrutiny of its price action, which is a better indicator of what you should do next. Price action reflects the current state of the market in the present moment. Even as of this writing, with European debt fears and a second recession looming over the horizon, the fact remains that the study of both price action and technical analysis will tell you what to do next rather than trying to trade based off a prediction on what is going to happen next. |

|
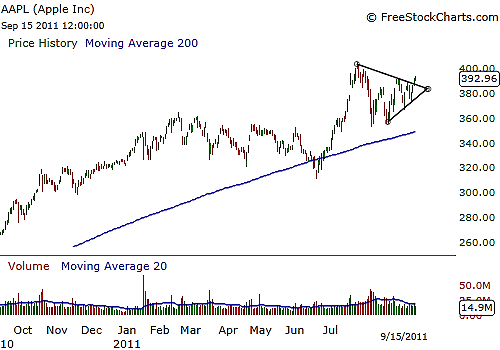
| FIGURE 1: AAPL. AAPL has recovered from a mild correction while the rest of the market was melting down and has managed to climb back and form a bullish triangle. Recently, it has traded through its upper trendline and appears to be resuming its uptrend. |
| Graphic provided by: www.freestockcharts.com. |
| |
| As a trader, you make money by being an interpreter of price action rather than a predictor of price action. An interpreter's job is to study the current condition of price and when the moment is right, you want to exploit the price trend like a surfer who swims out into the rough to spot when the conditions are right for him to latch onto a wave that is forming and then ride that momentum all the way back to the beach. Often, traders mistakenly assume that the money is made by anticipating what the future impact will be based on today's facts and place a position, only to join legions of failed investors and traders who have mistakenly gone down that path. Worse, some have been good at making predictions and have succeeded in making money based on those predictions, but over time, that trading approach is not sustainable. The markets are too fickle and unpredictable to be subjected to that kind of blind forecasting. |

|
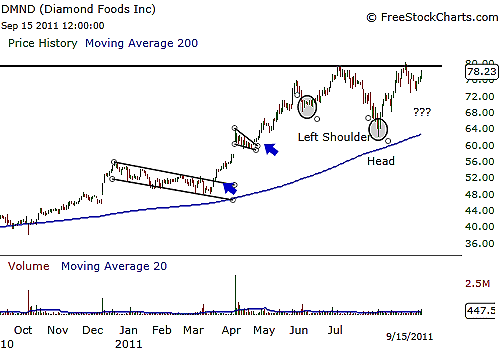
| FIGURE 2: DMND. Diamond Foods consolidated near its all-time highs during massive selling in the general market and formed an inverse head & shoulders pattern. If price trades up through the upper neckline of the pattern, it is likely to go higher from that point and resume its bullish trend. |
| Graphic provided by: www.freestockcharts.com. |
| |
| However, having a low-risk idea based on some future outlook is a viable strategy, provided that technical analysis confirms those ideas as they are played out in price action itself. Currently, the market is trying to mount some kind of rally back to the upside, but for now, it is clawing each step of the way in order to make up for the massive loss of ground it has given way to the bears. With the major indexes all trading under their 200-day simple moving average (SMA) -- a statistically proven clue that bears are in control -- they have a long fight ahead of them as selling volume continues to climb as price makes steady but little progress along the way. |

|
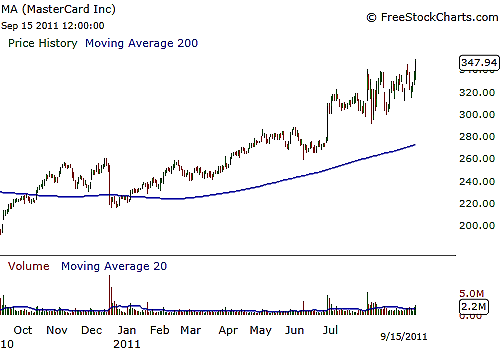
| FIGURE 3: MA. MasterCard has been trading in a tight range at its all-time high and stayed above its 200-day SMA even as the rest of the market has broken down. A stock like this that has maintained strength in an trading environment that has been marked by weakness is likely to emerge as a leader to take the market higher once its trend reverses. |
| Graphic provided by: www.freestockcharts.com. |
| |
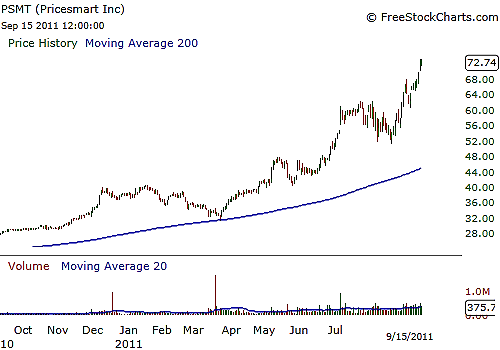
| To the point, indexes may be struggling, but other stock leaders tend to lead the indexes to the upside before a rally is revealed in their price action. Already, Apple Inc. (Figure 1), Diamond Foods (Figure 2), MasterCard (Figure 3), and PriceSmart (Figure 4) are making steady gains as well as maintaining their trading above the 200-day SMA as they retain their relative strength in a market where the bears appear to be firmly in control. |

|
| FIGURE 4: PSMT. PSMT is a stock worth watching since it has a combination of strong fundamentals, competitive edge in a hot market, and compelling price action where it continues to climb higher. This stock is likely to provide bullish opportunities even as the rest of the market struggles. |
| Graphic provided by: www.freestockcharts.com. |
| |
| On the Standard & Poor's 500, a bottom has formed but there has been no real conviction from the turning point back to the upside. If, though, price manages to trade above the August 31, 2011, of 1231, then a rally may be in the making, clearing the way for the stock leadership to climb higher. |
Billy Williams has been trading the markets for 27 years, specializing in momentum trading with stocks and options.
| Company: | StockOptionSystem.com |
| E-mail address: | stockoptionsystem.com@gmail.com |
Traders' Resource Links | |
| StockOptionSystem.com has not added any product or service information to TRADERS' RESOURCE. | |
Click here for more information about our publications!
PRINT THIS ARTICLE

Request Information From Our Sponsors
- StockCharts.com, Inc.
- Candle Patterns
- Candlestick Charting Explained
- Intermarket Technical Analysis
- John Murphy on Chart Analysis
- John Murphy's Chart Pattern Recognition
- John Murphy's Market Message
- MurphyExplainsMarketAnalysis-Intermarket Analysis
- MurphyExplainsMarketAnalysis-Visual Analysis
- StockCharts.com
- Technical Analysis of the Financial Markets
- The Visual Investor
- VectorVest, Inc.
- Executive Premier Workshop
- One-Day Options Course
- OptionsPro
- Retirement Income Workshop
- Sure-Fire Trading Systems (VectorVest, Inc.)
- Trading as a Business Workshop
- VectorVest 7 EOD
- VectorVest 7 RealTime/IntraDay
- VectorVest AutoTester
- VectorVest Educational Services
- VectorVest OnLine
- VectorVest Options Analyzer
- VectorVest ProGraphics v6.0
- VectorVest ProTrader 7
- VectorVest RealTime Derby Tool
- VectorVest Simulator
- VectorVest Variator
- VectorVest Watchdog
