
HOT TOPICS LIST
- MACD
- Fibonacci
- RSI
- Gann
- ADXR
- Stochastics
- Volume
- Triangles
- Futures
- Cycles
- Volatility
- ZIGZAG
- MESA
- Retracement
- Aroon
INDICATORS LIST
LIST OF TOPICS
PRINT THIS ARTICLE
by David Penn
The recent retreat in the CRB Index has some commodities bulls worried. Should they be?
Position: N/A
David Penn
Technical Writer for Technical Analysis of STOCKS & COMMODITIES magazine, Working-Money.com, and Traders.com Advantage.
PRINT THIS ARTICLE
BULL/BEAR MARKET
Corrections and Commodities
04/18/02 11:08:30 AMby David Penn
The recent retreat in the CRB Index has some commodities bulls worried. Should they be?
Position: N/A
| I recently received an e-mail from a trading advisory website I reviewed a few months ago for Stocks & Commodities magazine. One of the things the author of the e-mail mentioned, "the growing suspicion that the 'hot money' is leaving stocks and headed toward real assets (gold, real estate, commodities)," has remained with me. This is partly because this asset allocation theme has been gaining ground since early in 2000; a number of my favorite fundamentally oriented market analysts have also been increasingly sympathetic to a bull market in real assets. But I am also sympathetic to this asset allocation theme because of the evidence of a new bull market in commodities is especially compelling on a technical basis. |
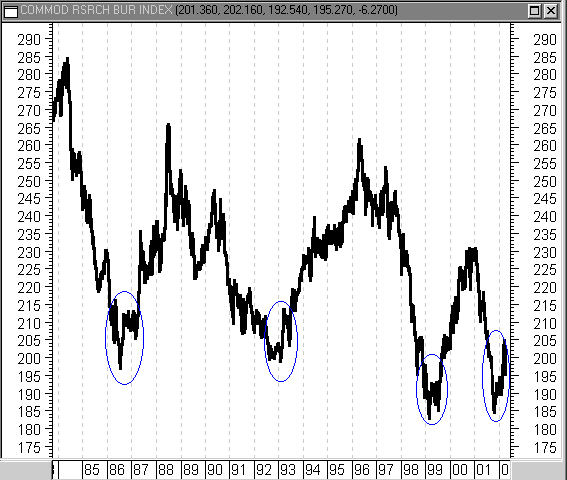
| This might come as a surprise to anyone who has been watching the commodities market --as represented by the CRB Index--over the past few weeks. Indeed after rallying from a three-year low of 184 in late 2001, the CRB index jumped up more than 11% by early 2002, topping out at 205. Unfortunately for CRB longs, the correction that followed this advance was swift, with about 48% of the OTB ('off the bottom') move already retraced. Given the sharpness of this correction, and the bear market from mid-2000 to late 2001 in commodities, the temptation to see the CRB's advance near the end of last year as little more than a fake out is, admittedly, great. |
|
| Figure 1: The three previous commodities bottoms have experienced significant pullbacks before the bull markets really began. |
| Graphic provided by: MetaStock. |
| |
| However, the history of the CRB's moves off the bottom suggests that the bulls might get the last laugh. Looking back at the beginnings of other bull markets in commodities: the 1999 trough, the 1993 trough, and the 1986 trough, it seems clear the sharp corrections are not at all uncommon when major advances begin in the commodities markets. From the 80% correction after the 1999 trough when commodities tried to rebound after a two and a half year bear market that sent the CRB Index from 265 to 183 (a decline of 31%) to the relatively mild 24% correction after the 1986 trough, it seems like significant pullbacks are an important part of OTB moves in commodities. Here is a list of the most recent bottoms in the CRB, the extent of their initial OTB rally, the degree of the correction, and lastly the date and price of the bull market top. July 1986 bottom: 196.5 Rally high: 213.5 Correction low: 205 July 1988 bull market top: 265 February 1993 bottom: 199 Rally high: 214 Correction low: 203 April 1996 bull market top: 262 February 1999 bottom: 183 Rally high: 193 Correction low: 185 January 2001 bull market top: 230 October 2001 bottom: 184 Rally high: 205 Correction low: ??? Bull market top: ??? |
| This suggests most immediately that commodities traders should see the current weakness in commodities as an opportunity to position themselves for a renewed bull market--as opposed to a resumption of the bearish trend in the CRB that began with the January 2001 top. A look at the charts of a number of commodities--from high grade copper to crude oil to lumber--shows a variety of powerful late 2001 bull markets, all of which petered out in the spring of 2002. While fundamentally oriented reasons abound for the collapse in many commodities--capital expenditures in technology remain sub-par depressing copper, U.S. involvement in the Middle East crisis has taken the steam out of crude oil, the prospect of higher interest rates has tempered homebuilding, softening demand for lumber... |
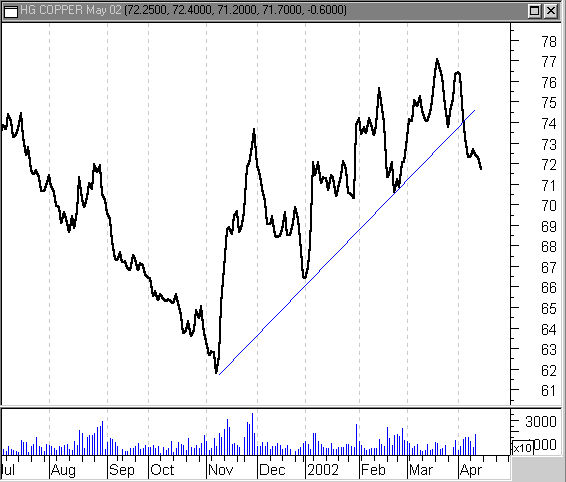 Figure 2: May copper's bull market is threatened by this trendline breakthough. Support looms between 70 and 71. 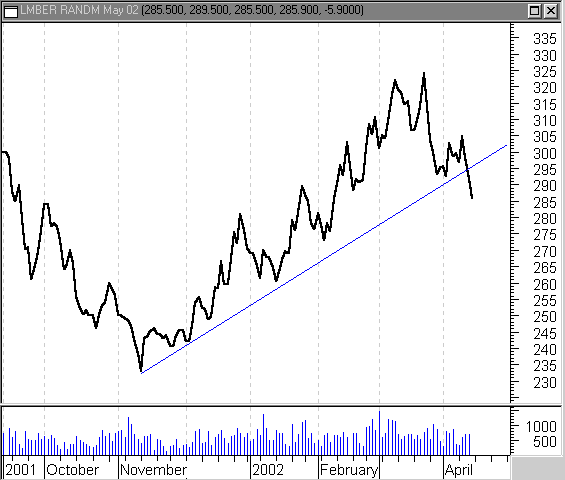 Figure 3: The lower highs in May lumber and this trendline break are ominous signs for lumber bulls. 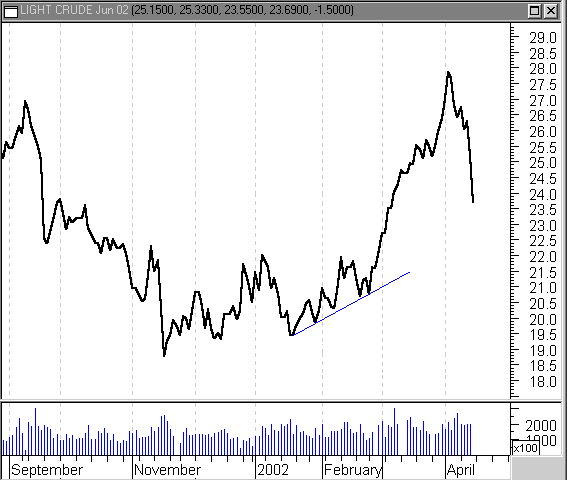 Figure 4: June crude took off in March, gaining over 22% in one month. Where will the selloff find support? 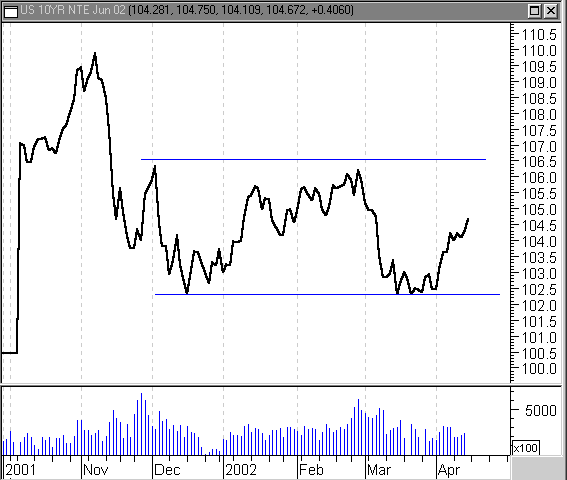 Figure 5: The June 10-year Treasury has been stuck in a range since mid-November. But its signals to the commodities markets remain clear. Technically-oriented traders and analysts will watch the CRB Index (and other commodities indexes) as well as individual commodities for signs that the markets have become too oversold too quickly, paving the way for a strong rebound in prices and a potential return to the bull market that began in the fall of 2001. Another market worth watching is the long-term bond market, particularly the 10-year Treasury note that has been moving up in April while commodities have been falling. The 10-year T-note is still technically in a range, moving neither up nor down consistently for any period of time. Yet bullishness in bonds is generally a negative for commodities (insofar as bonds anticipate inflation and rising commodities prices are often indicative of just that). If the 10-year T-note breaks out of its range on the upside, then there may indeed be cause for concern for those long commodities. However, if the T-note finds resistance at the top of its current range--about 106.5--then the long-awaited bull market in commodities might finally have begun. |
Technical Writer for Technical Analysis of STOCKS & COMMODITIES magazine, Working-Money.com, and Traders.com Advantage.
| Title: | Technical Writer |
| Company: | Technical Analysis, Inc. |
| Address: | 4757 California Avenue SW |
| Seattle, WA 98116 | |
| Phone # for sales: | 206 938 0570 |
| Fax: | 206 938 1307 |
| Website: | www.Traders.com |
| E-mail address: | DPenn@traders.com |
Traders' Resource Links | |
| Charting the Stock Market: The Wyckoff Method -- Books | |
| Working-Money.com -- Online Trading Services | |
| Traders.com Advantage -- Online Trading Services | |
| Technical Analysis of Stocks & Commodities -- Publications and Newsletters | |
| Working Money, at Working-Money.com -- Publications and Newsletters | |
| Traders.com Advantage -- Publications and Newsletters | |
| Professional Traders Starter Kit -- Software | |
Click here for more information about our publications!
Comments
Date: 04/23/02Rank: 5Comment:

|

Request Information From Our Sponsors
- StockCharts.com, Inc.
- Candle Patterns
- Candlestick Charting Explained
- Intermarket Technical Analysis
- John Murphy on Chart Analysis
- John Murphy's Chart Pattern Recognition
- John Murphy's Market Message
- MurphyExplainsMarketAnalysis-Intermarket Analysis
- MurphyExplainsMarketAnalysis-Visual Analysis
- StockCharts.com
- Technical Analysis of the Financial Markets
- The Visual Investor
- VectorVest, Inc.
- Executive Premier Workshop
- One-Day Options Course
- OptionsPro
- Retirement Income Workshop
- Sure-Fire Trading Systems (VectorVest, Inc.)
- Trading as a Business Workshop
- VectorVest 7 EOD
- VectorVest 7 RealTime/IntraDay
- VectorVest AutoTester
- VectorVest Educational Services
- VectorVest OnLine
- VectorVest Options Analyzer
- VectorVest ProGraphics v6.0
- VectorVest ProTrader 7
- VectorVest RealTime Derby Tool
- VectorVest Simulator
- VectorVest Variator
- VectorVest Watchdog
