HOT TOPICS LIST
- MACD
- Fibonacci
- RSI
- Gann
- ADXR
- Stochastics
- Volume
- Triangles
- Futures
- Cycles
- Volatility
- ZIGZAG
- MESA
- Retracement
- Aroon
INDICATORS LIST
LIST OF TOPICS
PRINT THIS ARTICLE
by Donald W. Pendergast, Jr.
After enduring a nearly 35% haircut between early July and late August, Huntington Bancshares common stock appears ready for a rebound.
Position: Buy
Donald W. Pendergast, Jr.
Donald W. Pendergast is a financial markets consultant who offers specialized services to stock brokers and high net worth individuals who seek a better bottom line for their portfolios.
PRINT THIS ARTICLE
TRADING SYSTEMS
Huntington Bancshares Breakout For Real?
09/15/11 08:27:26 AMby Donald W. Pendergast, Jr.
After enduring a nearly 35% haircut between early July and late August, Huntington Bancshares common stock appears ready for a rebound.
Position: Buy
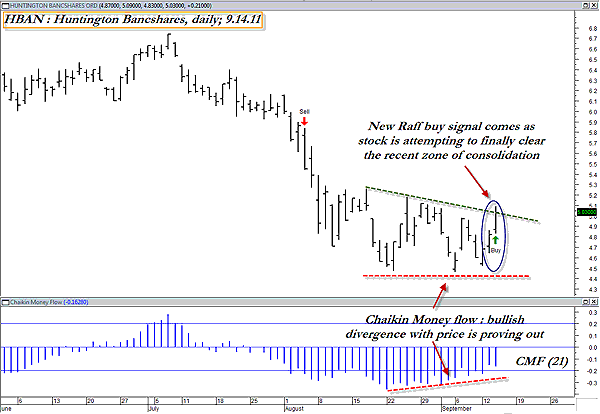
| As mentioned recently, the stocks in the financial sector always seem to get hit a bit harder than those in less economically and politically sensitive sectors. Yet, when they decide it's time to reclaim lost ground, the better-run financials always seem to make up lost ground in a hurry, particularly when the broad market decides to rally for a while. Here's a look at the daily chart of Huntington Bancshares (HBAN) and its very attractive long swing trade entry setup (Figure 1). |

|
| FIGURE 1: HBAN, DAILY. A successful test of support, positive money flow divergence, and a new Raff swing buy signal all suggest that higher prices may soon be in store for shares of Huntington Bancshares. |
| Graphic provided by: MetaStock. |
| Graphic provided by: Raff MarketSpace advisor from MetaStock. |
| |
| First off, the techniques presented here are relatively simple and straightforward. There are no wave counts, no Gann numerologies, no "Here today, gone tomorrow" cycle counts (well, they are a bit more dependable than some other techniques, to be sure) or other high-level charting skills required. No, all you really need to know is this: 1. Is the broad market showing signs of reversing higher? 2. If so, which large-cap stocks are flashing buy signals from historically reliable trading systems? 3. Of those stocks giving buy signals, which are strongest in terms of 13-week relative strength versus the .SPX, .NDX or .RUT? Once you have the answers, it isn't all that hard to find the better stocks to trade. Since the broad market is beginning the process of turning higher (how long this emerging rally will last is another question, of course), one of the simplest ways to find suitable long-side trading candidates is to run the Raff MarketSpace Stock system in MetaStock's Explorer, using all 500 .SPX component stocks. Today, it located HBAN as a new Raff long entry setup, and my own relative strength analysis confirmed that the stock was indeed outperforming the .SPX over the last calendar quarter. As I analyzed the chart I noticed the short-term money flow (the 21-day Chaikin money flow or (CMF)(21)) was showing a positive divergence setup with the price action on the chart and the stock was also attempting to complete a bullish breakout from a well-formed triangle pattern -- one coming after a successful test of support near the $4.50 area. It doesn't get much simpler than this, and even though it's impossible to tell if HBAN will move significantly higher, at the very least you know the basics of screening for stocks amid a potentially bullish broad market backdrop. |
| Like most swing trade setups, entering long on a buy-stop may be the preferred way to get in on this trade. If filled, simply run a two- to three-bar trailing stop of the daily lows until you are taken out of the trade. Use the two-bar if you are the nervous type and the three-bar if you believe that this setup has the potential to go for substantial swing trade-style gains in the next week or two. It's your call, so take some time and do some analysis of your own before taking the plunge and putting risk capital to work in the stock market. |
Donald W. Pendergast is a financial markets consultant who offers specialized services to stock brokers and high net worth individuals who seek a better bottom line for their portfolios.
| Title: | Writer, market consultant |
| Company: | Linear Trading Systems LLC |
| Jacksonville, FL 32217 | |
| Phone # for sales: | 904-239-9564 |
| E-mail address: | lineartradingsys@gmail.com |
Traders' Resource Links | |
| Linear Trading Systems LLC has not added any product or service information to TRADERS' RESOURCE. | |
Click here for more information about our publications!
PRINT THIS ARTICLE

Request Information From Our Sponsors
- StockCharts.com, Inc.
- Candle Patterns
- Candlestick Charting Explained
- Intermarket Technical Analysis
- John Murphy on Chart Analysis
- John Murphy's Chart Pattern Recognition
- John Murphy's Market Message
- MurphyExplainsMarketAnalysis-Intermarket Analysis
- MurphyExplainsMarketAnalysis-Visual Analysis
- StockCharts.com
- Technical Analysis of the Financial Markets
- The Visual Investor
- VectorVest, Inc.
- Executive Premier Workshop
- One-Day Options Course
- OptionsPro
- Retirement Income Workshop
- Sure-Fire Trading Systems (VectorVest, Inc.)
- Trading as a Business Workshop
- VectorVest 7 EOD
- VectorVest 7 RealTime/IntraDay
- VectorVest AutoTester
- VectorVest Educational Services
- VectorVest OnLine
- VectorVest Options Analyzer
- VectorVest ProGraphics v6.0
- VectorVest ProTrader 7
- VectorVest RealTime Derby Tool
- VectorVest Simulator
- VectorVest Variator
- VectorVest Watchdog
