HOT TOPICS LIST
- MACD
- Fibonacci
- RSI
- Gann
- ADXR
- Stochastics
- Volume
- Triangles
- Futures
- Cycles
- Volatility
- ZIGZAG
- MESA
- Retracement
- Aroon
INDICATORS LIST
LIST OF TOPICS
PRINT THIS ARTICLE
by Chaitali Mohile
Blue Coat System has plunged to a previous support level. Will the relief rally fill the gap down?
Position: N/A
Chaitali Mohile
Active trader in the Indian stock markets since 2003 and a full-time writer. Trading is largely based upon technical analysis.
PRINT THIS ARTICLE
CHART ANALYSIS
BCSI Refilling Gap
09/15/11 01:07:58 PMby Chaitali Mohile
Blue Coat System has plunged to a previous support level. Will the relief rally fill the gap down?
Position: N/A
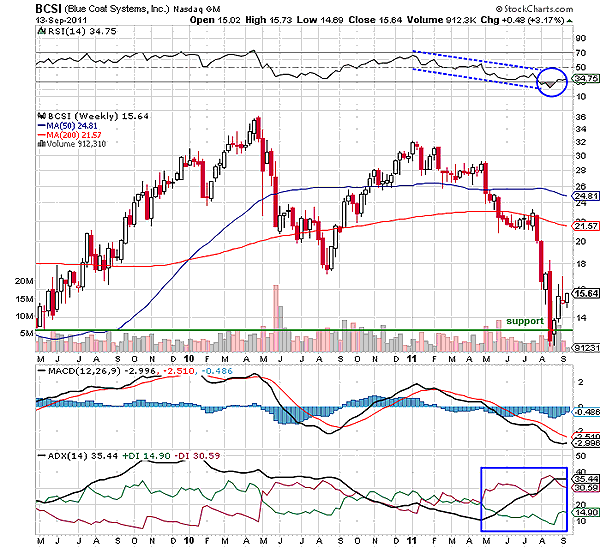
| Since early 2010, Blue Coat System (BCSI) has been trending down. In April 2010, you see a strong bearish engulfing candlestick pattern on the weekly time frame in Figure 1. The candlestick pattern indicated that the stock had formed a top and a fresh bearish rally was under way. Thereafter, BCSI descended to the 18 levels, converting the two major supports of the 50-day and 200-day moving averages (MA) to resistance. The bearish rally was born due to a highly overheated uptrend. The average directional index (ADX) (14) in Figure 1 had reached the 50 levels, indicating a trend reversal possibility. The relative strength index (RSI) (14) failed to drive above the 70 levels, suggesting poor strength for BCSI. This induced bearish pressure resulted in a heavy loss for the stock. Although the stock began its pullback rally immediately from the 18 levels, it formed a lower high at 32 levels, signifying strong bearish force. Thereafter, the stock once again declined, forming lower lows and lower highs. Such a declining rally shows significant bearish strength. |

|
| FIGURE 1: BCSI, WEEKLY |
| Graphic provided by: StockCharts.com. |
| |
| Eventually, the downside price action hit a previous low at 13 levels. The RSI (14) slipped along with the price rally becoming oversold below the 20 levels. The ADX (14) in Figure 1 is suggesting a developed downtrend. In addition, the moving average convergence/divergence (MACD) (12,26,9) is negative, highlighting bearish momentum for BCSI. The two bullish candlesticks of the relief rally in Figure 1 have shadows on either side, showing the conflict between the bulls and bears. However, the third red hollow doji is likely to clear the clouds of uncertainty, as the long upper shadow signifies weakness in sustaining at the high. The high and low of the previous long red candle would restrict the pullback by extending a very short-term support-resistance for BCSI. |
| Thus, it would be difficult for the stock to surge in the medium term. |

|
| FIGURE 2: BCSI, DAILY |
| Graphic provided by: StockCharts.com. |
| |
| BCSI has been descending under the resistance of the 50-day MA, which was challenged only once. The stock took a nosedive from 23. Though the price tried to surge, it failed and resumed its bearish rally. The selling pressure was at its peak due to when the stock had a huge gap down from 17.90 levels. BCSI consolidated after the gap down, preventing additional losses. The RSI (14) formed a higher low in an oversold area, suggesting a fresh bullish move. The MACD (12,26,9) in Figure 2 underwent a bullish crossover and the downtrend began plunging. This encouraged a relief rally from 13.50 levels. The earlier gap down was partially filled by the relief rally, however, and the stock later consolidated in the narrow range between 15 and 16. As a result, the gap filling process was discontinued. The support-resistance formed by the gap down still exists; the future bullish rally is likely to come under danger. |
| In addition, the 50-day MA resistance is declining, which would be one of the hurdles for the future rally. All three indicators have not shifted into healthy bullish zones. Thus, the gap down is not likely to get filled in the near term. |
Active trader in the Indian stock markets since 2003 and a full-time writer. Trading is largely based upon technical analysis.
| Company: | Independent |
| Address: | C1/3 Parth Indraprasth Towers. Vastrapur |
| Ahmedabad, Guj 380015 | |
| E-mail address: | chaitalimohile@yahoo.co.in |
Traders' Resource Links | |
| Independent has not added any product or service information to TRADERS' RESOURCE. | |
Click here for more information about our publications!
PRINT THIS ARTICLE

Request Information From Our Sponsors
- VectorVest, Inc.
- Executive Premier Workshop
- One-Day Options Course
- OptionsPro
- Retirement Income Workshop
- Sure-Fire Trading Systems (VectorVest, Inc.)
- Trading as a Business Workshop
- VectorVest 7 EOD
- VectorVest 7 RealTime/IntraDay
- VectorVest AutoTester
- VectorVest Educational Services
- VectorVest OnLine
- VectorVest Options Analyzer
- VectorVest ProGraphics v6.0
- VectorVest ProTrader 7
- VectorVest RealTime Derby Tool
- VectorVest Simulator
- VectorVest Variator
- VectorVest Watchdog
- StockCharts.com, Inc.
- Candle Patterns
- Candlestick Charting Explained
- Intermarket Technical Analysis
- John Murphy on Chart Analysis
- John Murphy's Chart Pattern Recognition
- John Murphy's Market Message
- MurphyExplainsMarketAnalysis-Intermarket Analysis
- MurphyExplainsMarketAnalysis-Visual Analysis
- StockCharts.com
- Technical Analysis of the Financial Markets
- The Visual Investor
