HOT TOPICS LIST
- MACD
- Fibonacci
- RSI
- Gann
- ADXR
- Stochastics
- Volume
- Triangles
- Futures
- Cycles
- Volatility
- ZIGZAG
- MESA
- Retracement
- Aroon
INDICATORS LIST
LIST OF TOPICS
PRINT THIS ARTICLE
by Donald W. Pendergast, Jr.
The semiconductor group got hit pretty hard in July and August, but a bullish breakout in shares of Intel Corp. now seems to imply that a rally may have begun.
Position: Buy
Donald W. Pendergast, Jr.
Donald W. Pendergast is a financial markets consultant who offers specialized services to stock brokers and high net worth individuals who seek a better bottom line for their portfolios.
PRINT THIS ARTICLE
TRADING SYSTEMS
A Breakup From The Bottom For Intel?
09/14/11 08:29:50 AMby Donald W. Pendergast, Jr.
The semiconductor group got hit pretty hard in July and August, but a bullish breakout in shares of Intel Corp. now seems to imply that a rally may have begun.
Position: Buy
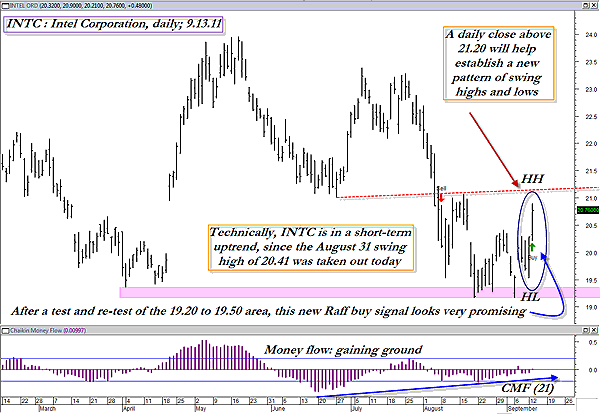
| As far as selloffs go, the slide in shares of Intel (INTC) during July and August was actually pretty mild, compared to the damage seen across the financial sector stocks. Still, a decline is a decline, and the only proof positive way to discern if a downtrend was over in a stock or futures contract was to determine the situation of its swing pattern, along with the use of some other technical tools. Let's do that now, using INTC's daily chart (Figure 1). |

|
| FIGURE 1: INTC, DAILY. Higher swing highs and higher swing lows after a major test of support are some of the technical highlights on INTC's daily chart. |
| Graphic provided by: MetaStock. |
| Graphic provided by: Gil Raff Expert Advisor from MetaStock 11. |
| |
| Yes, the larger-scale daily chart swings may still imply a downtrend, but since every new trend begins with small, sustained moves in a new direction, it's clear that INTC truly is in the beginning stages of an uptrending move, one that will take on even more significance should we soon see a daily close above the August 16th swing high of 21.07. For now, note the HL (higher low) and HH (higher high) tags on either end of Tuesday's wide-range price bar, indicating that a short-term uptrend is now in force. This is commencing at the same time that short-term money flow (Chaikin money flow [CMF][21]) is also improving. All of that is good info for INTC bulls to know, but what makes all of it even sweeter is the fact that INTC just passed a major test of support as it tested the April low of $19.36 on a mild overshoot to $19.16 on August 19 and then again at the same exact price on September 6 (see the pink-shaded zone on the chart). To now see the stock rocketing high in a series of higher highs/higher lows after such an important test of support has to be icing on the cake here. |
| Playing INTC on the long side? Why not, given all we've just identified on the chart! Swing traders can just buy-stop Tuesday's high ($20.90) plus a few ticks and then place a stop-loss a few ticks below Monday's swing low price of $19.52 before trailing the entire shebang with a two- to three-bar trailing stop of the daily lows. Covered-call types (we know you're out there) might want to go out a couple of months, using an at-the-money call (in this case, a $21 call option) and then managing the entire stock/option position by using a 21-day exponential moving average (EMA) to help you stay in the trade through any minor pullbacks or shakeouts. If you see a daily close below the 21-day EMA, then just close out the trade at a profit or loss and then wait for a more promising setup. All in all, this is a wonderful long trade setup, so trade it wisely with risk capital only. |
Donald W. Pendergast is a financial markets consultant who offers specialized services to stock brokers and high net worth individuals who seek a better bottom line for their portfolios.
| Title: | Writer, market consultant |
| Company: | Linear Trading Systems LLC |
| Jacksonville, FL 32217 | |
| Phone # for sales: | 904-239-9564 |
| E-mail address: | lineartradingsys@gmail.com |
Traders' Resource Links | |
| Linear Trading Systems LLC has not added any product or service information to TRADERS' RESOURCE. | |
Click here for more information about our publications!
PRINT THIS ARTICLE

Request Information From Our Sponsors
- VectorVest, Inc.
- Executive Premier Workshop
- One-Day Options Course
- OptionsPro
- Retirement Income Workshop
- Sure-Fire Trading Systems (VectorVest, Inc.)
- Trading as a Business Workshop
- VectorVest 7 EOD
- VectorVest 7 RealTime/IntraDay
- VectorVest AutoTester
- VectorVest Educational Services
- VectorVest OnLine
- VectorVest Options Analyzer
- VectorVest ProGraphics v6.0
- VectorVest ProTrader 7
- VectorVest RealTime Derby Tool
- VectorVest Simulator
- VectorVest Variator
- VectorVest Watchdog
- StockCharts.com, Inc.
- Candle Patterns
- Candlestick Charting Explained
- Intermarket Technical Analysis
- John Murphy on Chart Analysis
- John Murphy's Chart Pattern Recognition
- John Murphy's Market Message
- MurphyExplainsMarketAnalysis-Intermarket Analysis
- MurphyExplainsMarketAnalysis-Visual Analysis
- StockCharts.com
- Technical Analysis of the Financial Markets
- The Visual Investor
