HOT TOPICS LIST
- MACD
- Fibonacci
- RSI
- Gann
- ADXR
- Stochastics
- Volume
- Triangles
- Futures
- Cycles
- Volatility
- ZIGZAG
- MESA
- Retracement
- Aroon
INDICATORS LIST
LIST OF TOPICS
PRINT THIS ARTICLE
by Andrew Hetherington
The charts for Microsoft (MSFT) and the Dow Jones Industrial Average (DJIA) are at critical junctures and deserve a closer look.
Position: N/A
Andrew Hetherington
Classic Dow Theorist who trades as a pure technician, using pattern recognition.
PRINT THIS ARTICLE
FAN LINES
The Microsoft Effect
04/12/02 01:22:27 PMby Andrew Hetherington
The charts for Microsoft (MSFT) and the Dow Jones Industrial Average (DJIA) are at critical junctures and deserve a closer look.
Position: N/A
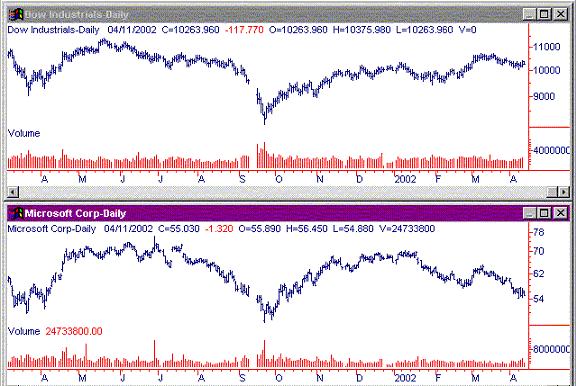
| Microsoft has a huge impact on the Dow as one can see from the charts in Figure 1. Since Microsoft had its legal troubles begin with the United States government the Dow has followed in its path. They don't follow precisely in tandem but it is somewhat synchronous. Naturally, General Electric is similar as well. The biggest and the strongest travel together, with one occasionally wandering off course, but mostly together. |
| The Dow and Microsoft are at a critical juncture after today. The Dow has closed below its third fan line while Microsoft hasn't broken its pattern quite yet. We don't want to get to negative on the Dow until it is below the line completely, which is likely to happen soon. The Nasdaq and the S&P 500 are already below the third fan lines. When the Dow drops they will go down hard. |

|
| Figure 1: Chart comparison between the Dow Industrials and MSFT. |
| Graphic provided by: SuperCharts. |
| |
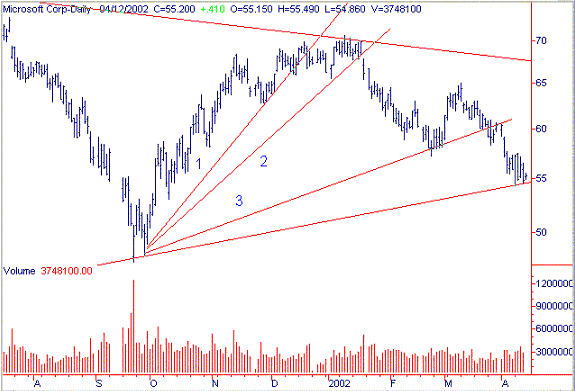
| Microsoft broke its third fan line 13 days ago, to change the temporary direction. Looking at Figure 2 we see this line was at the $60.00 area. The volume increased on the downside break. |
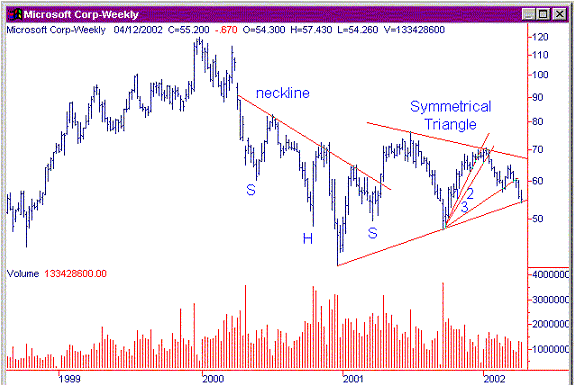
 Figure 2: Daily chart for MSFT. In addition, the larger picture in Figure 3 has a very nice 16-month symmetrical triangle. This triangle has decent volume on the creation of the pattern, diminishing from left to right. The bottom line on the triangle is in the $54.50 area with the upsloping line. In the past few months all similar symmetrical triangles have broken on the downside. The biggest and the strongest take longer to react towards the lack of confidence in the marketplace. |
 Figure 3: Weekly chart for MSFT. There are several ways to play this as a short. You can wait for the breaking on the downside and the inevitable pullback towards the $54.00 line. If it breaks down and doesn't pull back, look for other opportunities. An alternate choice is to play it short within the pattern if it jumps up a little towards the third fan line in the $62.00 area. If this doesn't happen, don't short it. |
Classic Dow Theorist who trades as a pure technician, using pattern recognition.
| Toronto, Canada |
Click here for more information about our publications!
Comments
Date: 04/16/02Rank: 5Comment:

Request Information From Our Sponsors
- StockCharts.com, Inc.
- Candle Patterns
- Candlestick Charting Explained
- Intermarket Technical Analysis
- John Murphy on Chart Analysis
- John Murphy's Chart Pattern Recognition
- John Murphy's Market Message
- MurphyExplainsMarketAnalysis-Intermarket Analysis
- MurphyExplainsMarketAnalysis-Visual Analysis
- StockCharts.com
- Technical Analysis of the Financial Markets
- The Visual Investor
- VectorVest, Inc.
- Executive Premier Workshop
- One-Day Options Course
- OptionsPro
- Retirement Income Workshop
- Sure-Fire Trading Systems (VectorVest, Inc.)
- Trading as a Business Workshop
- VectorVest 7 EOD
- VectorVest 7 RealTime/IntraDay
- VectorVest AutoTester
- VectorVest Educational Services
- VectorVest OnLine
- VectorVest Options Analyzer
- VectorVest ProGraphics v6.0
- VectorVest ProTrader 7
- VectorVest RealTime Derby Tool
- VectorVest Simulator
- VectorVest Variator
- VectorVest Watchdog
