HOT TOPICS LIST
- MACD
- Fibonacci
- RSI
- Gann
- ADXR
- Stochastics
- Volume
- Triangles
- Futures
- Cycles
- Volatility
- ZIGZAG
- MESA
- Retracement
- Aroon
INDICATORS LIST
LIST OF TOPICS
PRINT THIS ARTICLE
by Koos van der Merwe
On July 14, I wrote an article titled "American Axel & Manufacturing Inverse H&S In The Making."
Position: Sell
Koos van der Merwe
Has been a technical analyst since 1969, and has worked as a futures and options trader with First Financial Futures in Johannesburg, South Africa.
PRINT THIS ARTICLE
HEAD & SHOULDERS
A Failed Inverse Head & Shoulders
09/12/11 12:58:52 PMby Koos van der Merwe
On July 14, I wrote an article titled "American Axel & Manufacturing Inverse H&S In The Making."
Position: Sell
| I concluded the article by writing, "However, the share price has now formed an inverse head & shoulders formation, suggesting a target of $13.60. With the price at $11.32, this is a comfortable return. I would be a buyer of AXL once the price moves above the neckline at $11.66." |

|
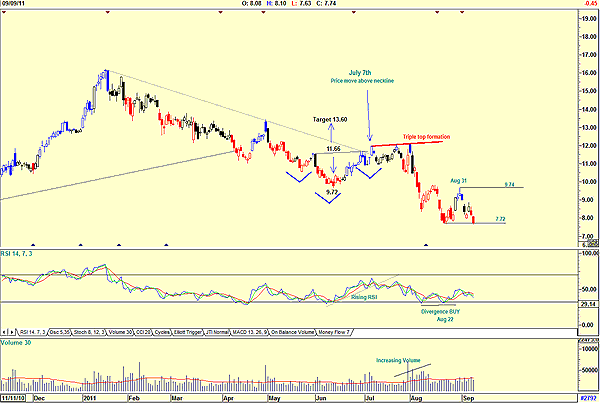
| FIGURE 1: AXL. Here's the chart showing a failed inverse head & shoulders formation. |
| Graphic provided by: AdvancedGET. |
| |
| A look at Figure 1 shows that the price did rise above the $11.66 neckline on July 7, giving a buy signal, confirmed by a rising relative strength index (RSI), but it fell back rather promptly without the RSI reaching overbought levels. It retested the new high formed on July 7 three times, forming a triple-top formation and then fell back to make new lows on increasing volume at the $7.72 level. Since then, the share price has moved sideways on steady volume, possibly forming a double bottom, to be confirmed only if the price broke above the $9.74 high of August 31. Should the price move below the $7.72 level, which could happen in spite of an RSI that gave a divergence buy signal on August 22, a buy signal confirmed as the price rose from $7.72 to $9.74, then we could see a considerable drop in price, with the RSI probably once again falling below its 32 level. Unfortunately, patterns do fail, and the month of September, notorious for being the worst and quietest month of the year, does see many buy formation patterns fail. AXL could see the share price test new lows possibly offering a buy opportunity should a buy formation/pattern form. |
Has been a technical analyst since 1969, and has worked as a futures and options trader with First Financial Futures in Johannesburg, South Africa.
| Address: | 3256 West 24th Ave |
| Vancouver, BC | |
| Phone # for sales: | 6042634214 |
| E-mail address: | petroosp@gmail.com |
Click here for more information about our publications!
PRINT THIS ARTICLE

Request Information From Our Sponsors
- VectorVest, Inc.
- Executive Premier Workshop
- One-Day Options Course
- OptionsPro
- Retirement Income Workshop
- Sure-Fire Trading Systems (VectorVest, Inc.)
- Trading as a Business Workshop
- VectorVest 7 EOD
- VectorVest 7 RealTime/IntraDay
- VectorVest AutoTester
- VectorVest Educational Services
- VectorVest OnLine
- VectorVest Options Analyzer
- VectorVest ProGraphics v6.0
- VectorVest ProTrader 7
- VectorVest RealTime Derby Tool
- VectorVest Simulator
- VectorVest Variator
- VectorVest Watchdog
- StockCharts.com, Inc.
- Candle Patterns
- Candlestick Charting Explained
- Intermarket Technical Analysis
- John Murphy on Chart Analysis
- John Murphy's Chart Pattern Recognition
- John Murphy's Market Message
- MurphyExplainsMarketAnalysis-Intermarket Analysis
- MurphyExplainsMarketAnalysis-Visual Analysis
- StockCharts.com
- Technical Analysis of the Financial Markets
- The Visual Investor
