HOT TOPICS LIST
- MACD
- Fibonacci
- RSI
- Gann
- ADXR
- Stochastics
- Volume
- Triangles
- Futures
- Cycles
- Volatility
- ZIGZAG
- MESA
- Retracement
- Aroon
INDICATORS LIST
LIST OF TOPICS
PRINT THIS ARTICLE
by Gary Grosschadl
When stocks or indexes make or challenge new highs they can possibly foretell coming failure by way of diverging or conflicting signals.
Traders can do well following these indications that all is not well with the current rise.
Position: N/A
Gary Grosschadl
Independent Canadian equities trader and technical analyst based in Peterborough
Ontario, Canada.
PRINT THIS ARTICLE
The Power of Multiple Negative Divergences
04/15/02 02:22:35 PMby Gary Grosschadl
When stocks or indexes make or challenge new highs they can possibly foretell coming failure by way of diverging or conflicting signals.
Traders can do well following these indications that all is not well with the current rise.
Position: N/A
| Many times traders are caught in a quandry as they try to analyze charts due to mixed signals suggesting that the equity can go either way. There are times however when the weight of evidence tilts in your favour. One to watch for is multiple divergences, in this case negative divergences from stock price or index levels. |
| The most common divergence is simply a divergence in volume. When a stock or index makes or attempts to make a new high (i.e. double or triple top) and the volume weakens, this shows that fewer traders share bullish convictions. This becomes a warning that the rise may be suspect and to prepare for a possible nasty decline, at least in the short term. |

|
| Graphic provided by: stockcharts.com. |
| |
| Traders should look to other divergences as well to add to the weight of evidence. The more divergences you find, the more strength of conviction you will have in making the correct trading decision. Often chart indicators give you a mixed blessing of sorts, as they do not always agree. But when you see multiple divergences, they can be a great trading signal. |
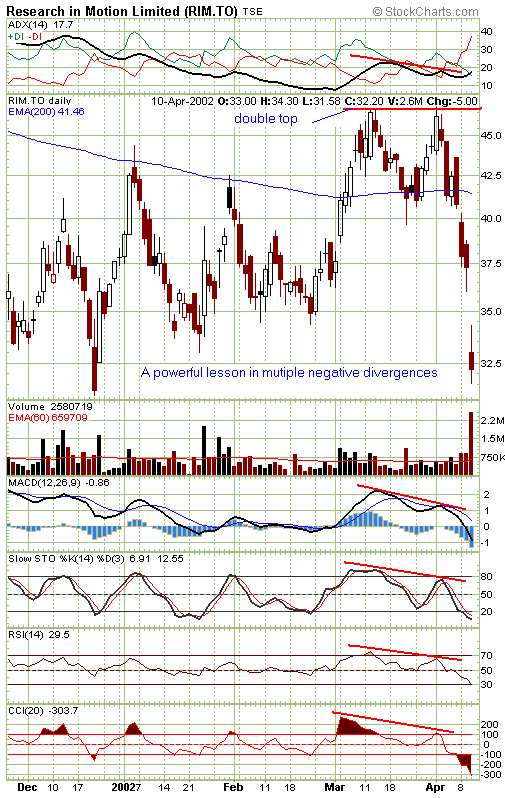
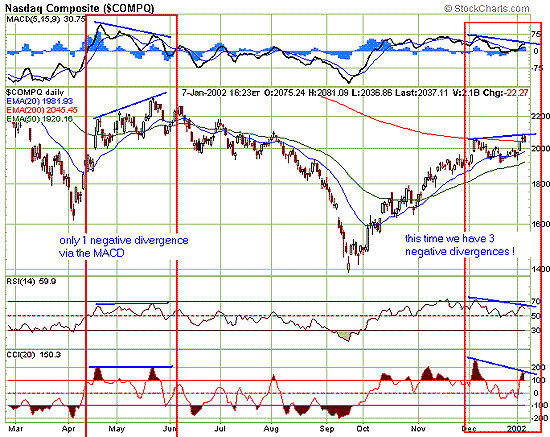
| When looking for divergence from price action this trader prefers moving average convergence/divergence (MACD), stochastics, relative strength index (RSI), average directional movement index (ADX), and channel commodity index (CCI). Note on the two chart examples how big moves were foretold by multiple divergences. |
| In the case of the Canadian wireless play RIM, shown in Figure 1, we see how a double top failure was correctly interpreted by multiple divergences. Also note that failure of the stock to stay above the 200-EMA line showed more downside coming. Divergences also work very well when charting indices. Figure 2 shows how the recent 400 point plunge from the Nasdaq composite was aptly warned by multiple negative divergences. Back in May, 2001 we see only one divergence (MACD) but as it turned out it was correct in it's bearish overtones. However the more recent Nasdaq plunge gave a big divergence warning and traders comfortable with indicators did well to take heed.  Figure 2: Here is an illustration of divergences between the price trend for the Nasdaq and various indicator trends. When the price is moving up, the indicators are moving down. Some words of caution, always wait for PRICE ACTION to confirm what divergent indicators suggest as price action rules otherwise there can be no true change in trend. |
Independent Canadian equities trader and technical analyst based in Peterborough
Ontario, Canada.
| Website: | www.whatsonsale.ca/financial.html |
| E-mail address: | gwg7@sympatico.ca |
Click here for more information about our publications!
Comments
Date: 04/16/02Rank: 4Comment:
Date: 04/16/02Rank: 5Comment:
Date: 04/16/02Rank: 3Comment: Hindsight is the best....If you wait for price action to confirm...then it s too late to profit???
Date: 04/21/02Rank: 5Comment:
Date: 04/25/02Rank: 5Comment:

Request Information From Our Sponsors
- StockCharts.com, Inc.
- Candle Patterns
- Candlestick Charting Explained
- Intermarket Technical Analysis
- John Murphy on Chart Analysis
- John Murphy's Chart Pattern Recognition
- John Murphy's Market Message
- MurphyExplainsMarketAnalysis-Intermarket Analysis
- MurphyExplainsMarketAnalysis-Visual Analysis
- StockCharts.com
- Technical Analysis of the Financial Markets
- The Visual Investor
- VectorVest, Inc.
- Executive Premier Workshop
- One-Day Options Course
- OptionsPro
- Retirement Income Workshop
- Sure-Fire Trading Systems (VectorVest, Inc.)
- Trading as a Business Workshop
- VectorVest 7 EOD
- VectorVest 7 RealTime/IntraDay
- VectorVest AutoTester
- VectorVest Educational Services
- VectorVest OnLine
- VectorVest Options Analyzer
- VectorVest ProGraphics v6.0
- VectorVest ProTrader 7
- VectorVest RealTime Derby Tool
- VectorVest Simulator
- VectorVest Variator
- VectorVest Watchdog
