HOT TOPICS LIST
- MACD
- Fibonacci
- RSI
- Gann
- ADXR
- Stochastics
- Volume
- Triangles
- Futures
- Cycles
- Volatility
- ZIGZAG
- MESA
- Retracement
- Aroon
INDICATORS LIST
LIST OF TOPICS
PRINT THIS ARTICLE
by Chaitali Mohile
The bullish rallies of Ameren were stopped by psychological resistance.
Position: N/A
Chaitali Mohile
Active trader in the Indian stock markets since 2003 and a full-time writer. Trading is largely based upon technical analysis.
PRINT THIS ARTICLE
TECHNICAL ANALYSIS
Ameren Unable To Breach Resistance
09/09/11 01:07:17 PMby Chaitali Mohile
The bullish rallies of Ameren were stopped by psychological resistance.
Position: N/A
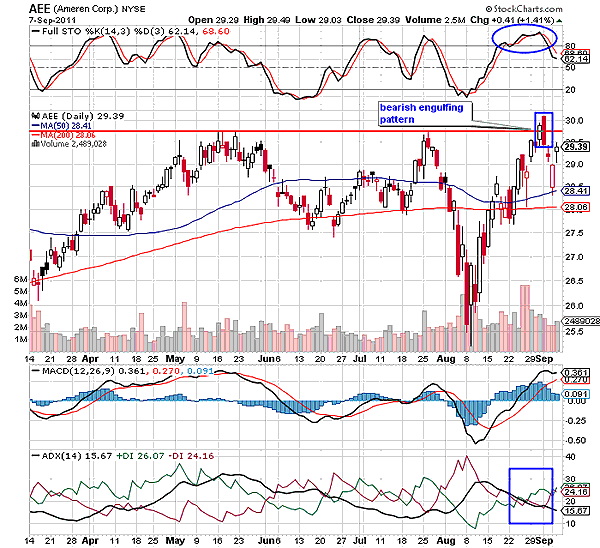
| The financial markets across the globe are undergoing volatile trading sessions. Stocks and indexes are struggling to establish support. In such situations, it is advisable to look for the weak stocks that are likely to move down, identify their nearest supports, and analyze whether the stock or index is likely to breach that support. Ameren Corp. (AEE) is one such example. We can see in Figure 1 that AEE has been hitting resistance at 30. The price rally failed to violate resistance and plunged to the 200-day moving average (MA) support. In August 2011, the stock breached the 200-day MA, indicating robust bearish force in the rally. Although the stock recovered sharply, it could not cross the resistance line. Recently, AEE has formed a bearish engulfing candlestick pattern (Figure 1). |

|
| FIGURE 1: AEE, DAILY |
| Graphic provided by: StockCharts.com. |
| |
| The candlestick pattern reflects that AEE is filled with bearish strength, and thus, the rally is unlikely to surge above the previous high resistance at 30 levels. After the candlestick formation, the stock immediately retraced toward the 200-day MA support with a small gap down. A highly overbought full stochastic (14,3,3) is drifting down, highlighting diminishing momentum in the rally. The moving average convergence/divergence (MACD) (12,26,9) is likely to undergo a bearish crossover near the zero line in Figure 1. The average directional index (ADX) (14) is below 20 levels, and the selling and buying pressure is moving with equal pressure. This suggested that AEE is likely to consolidate at the 200-day MA support. AEE would slip below the MA support only if the stochastic and MACD (12,26,9) plunged in bearish territories. However, we have to refer to the weekly chart also before initiating any short positions. |

|
| FIGURE 2: AEE, WEEKLY |
| Graphic provided by: StockCharts.com. |
| |
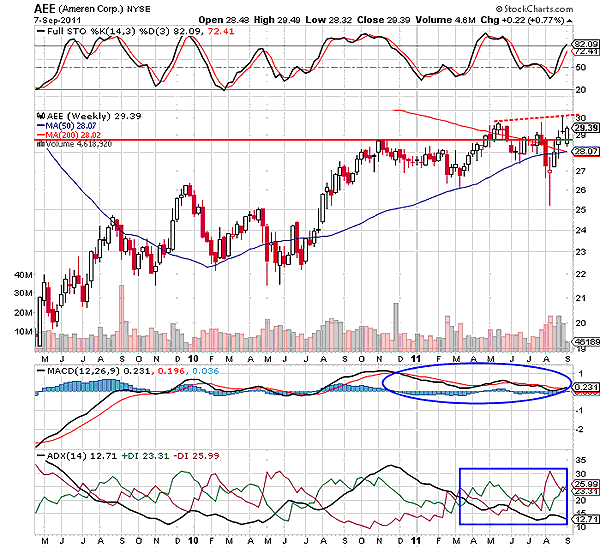
| On the weekly chart in Figure 2, we can see that there is a very narrow gap between the previous high or the psychological high and the support-resistance line at 28 levels. AEE has hardly sustained between these zones. We can see two doji candlesticks with the long upper shadows near the upper resistance levels. The 200-day MA and the 50-day moving average (MA) are converging to undergo a bearish moving average crossover. The stock would weaken further once the bearish crossover is confirmed. Currently, the price is trapped in a very narrow range, trying to establish support at the 200-day MA. |
| The full stochastic (14,3,3) is heading towards the highly overbought level but it is a little jittery. The trend indicator is very weak, and the MACD (12,26,9) is indicating high volatility. Therefore, the weekly chart in Figure 2 is bearish. The stock would undergo a serious correction below the MA support. |
| To conclude, stocks like AEE should be identified during the bearish market trend. They are likely to give profits by triggering short positions for a short-term period. |
Active trader in the Indian stock markets since 2003 and a full-time writer. Trading is largely based upon technical analysis.
| Company: | Independent |
| Address: | C1/3 Parth Indraprasth Towers. Vastrapur |
| Ahmedabad, Guj 380015 | |
| E-mail address: | chaitalimohile@yahoo.co.in |
Traders' Resource Links | |
| Independent has not added any product or service information to TRADERS' RESOURCE. | |
Click here for more information about our publications!
Comments

Request Information From Our Sponsors
- VectorVest, Inc.
- Executive Premier Workshop
- One-Day Options Course
- OptionsPro
- Retirement Income Workshop
- Sure-Fire Trading Systems (VectorVest, Inc.)
- Trading as a Business Workshop
- VectorVest 7 EOD
- VectorVest 7 RealTime/IntraDay
- VectorVest AutoTester
- VectorVest Educational Services
- VectorVest OnLine
- VectorVest Options Analyzer
- VectorVest ProGraphics v6.0
- VectorVest ProTrader 7
- VectorVest RealTime Derby Tool
- VectorVest Simulator
- VectorVest Variator
- VectorVest Watchdog
- StockCharts.com, Inc.
- Candle Patterns
- Candlestick Charting Explained
- Intermarket Technical Analysis
- John Murphy on Chart Analysis
- John Murphy's Chart Pattern Recognition
- John Murphy's Market Message
- MurphyExplainsMarketAnalysis-Intermarket Analysis
- MurphyExplainsMarketAnalysis-Visual Analysis
- StockCharts.com
- Technical Analysis of the Financial Markets
- The Visual Investor
