HOT TOPICS LIST
- MACD
- Fibonacci
- RSI
- Gann
- ADXR
- Stochastics
- Volume
- Triangles
- Futures
- Cycles
- Volatility
- ZIGZAG
- MESA
- Retracement
- Aroon
INDICATORS LIST
LIST OF TOPICS
PRINT THIS ARTICLE
by Koos van der Merwe
As the market starts recovering, Ford Motor looks like a good buy for a long-term hold.
Position: Accumulate
Koos van der Merwe
Has been a technical analyst since 1969, and has worked as a futures and options trader with First Financial Futures in Johannesburg, South Africa.
PRINT THIS ARTICLE
ANDREWS PITCH-FORK
Driving Ford
09/08/11 09:00:42 AMby Koos van der Merwe
As the market starts recovering, Ford Motor looks like a good buy for a long-term hold.
Position: Accumulate
| My index charts are suggesting a bull market, although a slow one as politics in the United States take preference over the US economy. There is also Europe, which is recovering far slower than expected because of varying economic disciplines within the euro currency countries. However, when Howard Schultz of Starbucks calls on all companies to withhold donations to political parties until they make the economy their priority, and again never forgetting that the world catches cold only when US sneezes and not the other way around, then it is definitely time to look for stocks to buy. |

|
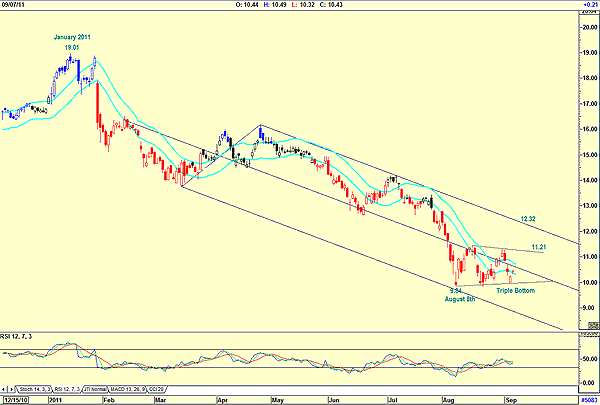
| FIGURE 1: FORD. Ford shows an Andrews pitchfork plus a triple-bottom formation. |
| Graphic provided by: AdvancedGET. |
| |
| Figure 1 is that of Ford Motor Co. (F). The chart shows how Ford dropped from $19.01 in January 2011 to a low of $9.84 by August 2011, a drop caused simply by uncertainty in the US and Europe. Yes, September is notorious for being the quietest month of the year for the market, but it's also a month that presents solid buying opportunities. The chart is suggesting a triple bottom, with a move above $11.21 suggesting a buy signal. Do note the relative strength index (RSI), which suggested a buy on August 8, and which has been rising slowly. The chart also shows an Andrews pitchfork. Alan Andrews developed this technique of drawing a pitchfork based upon a median line. Andrews' rules state that the market will do one of two things as it approaches the median line: 1. The market will reverse at the median line. 2. The market will trade through the median line and head for the upper parallel line and then reverse. As you can see on the chart, the price appears to be trading around the median line. Ford Motor is a share that I would buy but only when it breaks above the $11.21 resistance line, with a possible target to $12.32. A break above the upper pitchfork line will see a definite new trend in place. |
Has been a technical analyst since 1969, and has worked as a futures and options trader with First Financial Futures in Johannesburg, South Africa.
| Address: | 3256 West 24th Ave |
| Vancouver, BC | |
| Phone # for sales: | 6042634214 |
| E-mail address: | petroosp@gmail.com |
Click here for more information about our publications!
PRINT THIS ARTICLE

Request Information From Our Sponsors
- StockCharts.com, Inc.
- Candle Patterns
- Candlestick Charting Explained
- Intermarket Technical Analysis
- John Murphy on Chart Analysis
- John Murphy's Chart Pattern Recognition
- John Murphy's Market Message
- MurphyExplainsMarketAnalysis-Intermarket Analysis
- MurphyExplainsMarketAnalysis-Visual Analysis
- StockCharts.com
- Technical Analysis of the Financial Markets
- The Visual Investor
- VectorVest, Inc.
- Executive Premier Workshop
- One-Day Options Course
- OptionsPro
- Retirement Income Workshop
- Sure-Fire Trading Systems (VectorVest, Inc.)
- Trading as a Business Workshop
- VectorVest 7 EOD
- VectorVest 7 RealTime/IntraDay
- VectorVest AutoTester
- VectorVest Educational Services
- VectorVest OnLine
- VectorVest Options Analyzer
- VectorVest ProGraphics v6.0
- VectorVest ProTrader 7
- VectorVest RealTime Derby Tool
- VectorVest Simulator
- VectorVest Variator
- VectorVest Watchdog
