HOT TOPICS LIST
- MACD
- Fibonacci
- RSI
- Gann
- ADXR
- Stochastics
- Volume
- Triangles
- Futures
- Cycles
- Volatility
- ZIGZAG
- MESA
- Retracement
- Aroon
INDICATORS LIST
LIST OF TOPICS
PRINT THIS ARTICLE
by Alan R. Northam
Long-term statistical analysis shows General Electric entering into a primary bear market.
Position: N/A
Alan R. Northam
Alan Northam lives in the Dallas, Texas area and as an electronic engineer gave him an analytical mind from which he has developed a thorough knowledge of stock market technical analysis. His abilities to analyze the future direction of the stock market has allowed him to successfully trade of his own portfolio over the last 30 years. Mr. Northam is now retired and trading the stock market full time. You can reach him at inquiry@tradersclassroom.com or by visiting his website at http://www.tradersclassroom.com. You can also follow him on Twitter @TradersClassrm.
PRINT THIS ARTICLE
STATISTICS
General Electric Enters Bear Market
09/07/11 08:58:37 AMby Alan R. Northam
Long-term statistical analysis shows General Electric entering into a primary bear market.
Position: N/A
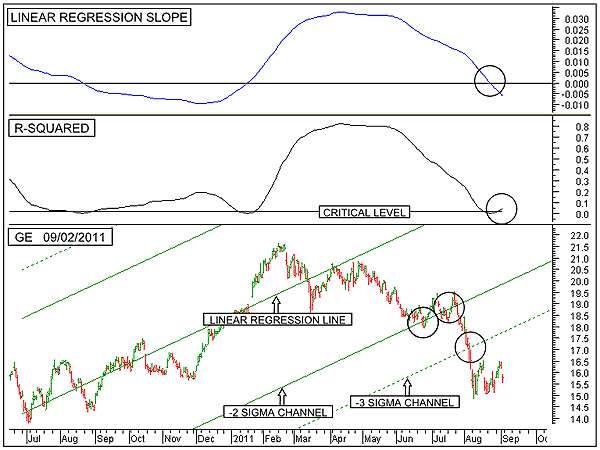
| The lower panel of Figure 1 shows the daily price bars of General Electric (GE). This figure also shows the 200-day linear regression trendline (middle green line), along with the upper and lower two sigma and three sigma channel lines. In mid-June, GE broke down below the lower two sigma channel line to warn of a possible reversal in trend from a long-term primary bull market to a primary bear market. Subsequently, GE broke down below its lower two signal channel line two additional times before finally moving lower, providing a total of three warnings that the primary bull market for GE was possibly coming to an end. Then in late July, GE broke down below the lower three sigma channel line to signal a reversal in trend. |

|
| FIGURE 1: GE, DAILY. This chart shows the daily price chart of General Electric in the lower panel along with its upsloping 200-day linear regression trendline and its upper and lower two and three sigma channel lines. The top panel shows the linear regression slope indicator followed by the R-squared indicator. |
| Graphic provided by: MetaStock. |
| |
| Looking at the linear regression slope indicator in the top panel of Figure 1, note that this indicator is now below its zero line, indicating that the primary trend is now downward. This indicator crossed below its zero line 15 trading sessions following the breakdown of the lower three sigma channel line to mark the beginning of a new long-term primary bear market for GE. |
| The next lower panel shows the R-squared indicator that measures the confidence of the trend as well as its strength. This indicator has now moved above its critical level, indicating that there is a 95% confidence level that this new primary bear market trend will continue. Note that as long as this indicator continues to move in an upward direction, the newfound bear market trend will continue to strengthen. |
| In conclusion, this statistical analysis shows that the primary bull market trend of GE has come to an end and a new primary bear market trend has been established. As long as the linear regression slope indicator continues to move downward below its zero line and the R-squared indicator continues to move upward, the bear market trend will continue. |
Alan Northam lives in the Dallas, Texas area and as an electronic engineer gave him an analytical mind from which he has developed a thorough knowledge of stock market technical analysis. His abilities to analyze the future direction of the stock market has allowed him to successfully trade of his own portfolio over the last 30 years. Mr. Northam is now retired and trading the stock market full time. You can reach him at inquiry@tradersclassroom.com or by visiting his website at http://www.tradersclassroom.com. You can also follow him on Twitter @TradersClassrm.
| Garland, Tx | |
| Website: | www.tradersclassroom.com |
| E-mail address: | inquiry@tradersclassroom.com |
Click here for more information about our publications!
PRINT THIS ARTICLE

Request Information From Our Sponsors
- StockCharts.com, Inc.
- Candle Patterns
- Candlestick Charting Explained
- Intermarket Technical Analysis
- John Murphy on Chart Analysis
- John Murphy's Chart Pattern Recognition
- John Murphy's Market Message
- MurphyExplainsMarketAnalysis-Intermarket Analysis
- MurphyExplainsMarketAnalysis-Visual Analysis
- StockCharts.com
- Technical Analysis of the Financial Markets
- The Visual Investor
- VectorVest, Inc.
- Executive Premier Workshop
- One-Day Options Course
- OptionsPro
- Retirement Income Workshop
- Sure-Fire Trading Systems (VectorVest, Inc.)
- Trading as a Business Workshop
- VectorVest 7 EOD
- VectorVest 7 RealTime/IntraDay
- VectorVest AutoTester
- VectorVest Educational Services
- VectorVest OnLine
- VectorVest Options Analyzer
- VectorVest ProGraphics v6.0
- VectorVest ProTrader 7
- VectorVest RealTime Derby Tool
- VectorVest Simulator
- VectorVest Variator
- VectorVest Watchdog
