HOT TOPICS LIST
- MACD
- Fibonacci
- RSI
- Gann
- ADXR
- Stochastics
- Volume
- Triangles
- Futures
- Cycles
- Volatility
- ZIGZAG
- MESA
- Retracement
- Aroon
INDICATORS LIST
LIST OF TOPICS
PRINT THIS ARTICLE
by Donald W. Pendergast, Jr.
Although shares of Newmont Mining aren't doing as well as you might think with the price of gold now at over $1,800 per ounce, the fact that the stock in sitting at an 11-month high is surely good news for bullish precious metals stock traders.
Position: N/A
Donald W. Pendergast, Jr.
Donald W. Pendergast is a financial markets consultant who offers specialized services to stock brokers and high net worth individuals who seek a better bottom line for their portfolios.
PRINT THIS ARTICLE
NEW HIGHS-NEW LOWS
Newmont Mining At 11-Month High
09/06/11 09:23:20 AMby Donald W. Pendergast, Jr.
Although shares of Newmont Mining aren't doing as well as you might think with the price of gold now at over $1,800 per ounce, the fact that the stock in sitting at an 11-month high is surely good news for bullish precious metals stock traders.
Position: N/A
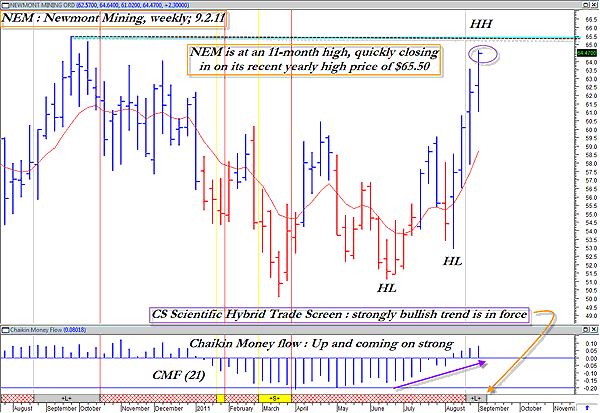
| One of the better expert advisor templates in MetaStock 11 is the CS Scientific Inc. Hybrid Trade Screen. If you want a simple, objective, no-nonsense visual guide to help you evaluate the market you wish to trade, then this has got to be the hot setup. Right now, this MetaStock expert confirms that shares of NEM are in strongly trending bullish mode on both the daily and weekly time frames, which may imply that there is more upside yet to be seen in this powerhouse metals giant's stock price. Here's a closer look now. |

|
| FIGURE 1: NEM, WEEKLY. |
| Graphic provided by: MetaStock. |
| Graphic provided by: CS Scientific Expert Advisor from MetaStock. |
| |
| This weekly graph of NEM (Figure 1) shares is valuable to many kinds of traders, including daytraders, swing traders, and position traders. The stock is now at an 11-month high and is only about a dollar shy of meeting its most recent 52-week high price of $65.50, and if you know anything at all about 52-week highs, then you already realize that there is a high likelihood of NEM meeting or exceeding that particular price magnet in the next week or two, especially as we examine the tremendous trend strength that is propelling the stock ever higher. At the bottom of the chart area you'll note the multicolored ribbons that help define whether a market is bullish, bearish, or neutral. As of this writing, the weekly chart is in the strongly bullish mode (the gray ribbon with the +L+ within), the price bars are blue, the money flow is rising sharply (the 21-week Chaikin Money flow), and the stock has also begun to trace out a pattern of higher highs and higher lows (notated as HL and HH on the chart). All that's needed now is for sharp traders to decide how to best take advantage of this powerful bullish run in NEM. |
| 1. Conservative traders might want to go the old covered-call route -- which will be a terrific strategy if the stock soon powers to a fresh 52-week high, drawing in even more institutional money. 2. Swing traders, especially those relying on 30- to 60-minute charts to help time entries, might consider looking to put on new longs near key intraday support levels like Fib confluences, floor trader pivots, and moving averages, using the daily chart as a trend guide. 3. Day traders (say, those using three- to 10-minute charts) can rely on the same kinds of tactics, only this time using the 30- to 60-minute charts as a trend guide. See Figure 2. |
| The precious metals markets continue to surprise, and even though the bull run in gold is more than a decade old now, all systems appear to be a go for those willing and able to stay on the right side of these super-volatile markets. Now that you know the dominant weekly trend for Newmont, you, too, should have little trouble in identifying ways to extract profits from this stock. |
Donald W. Pendergast is a financial markets consultant who offers specialized services to stock brokers and high net worth individuals who seek a better bottom line for their portfolios.
| Title: | Writer, market consultant |
| Company: | Linear Trading Systems LLC |
| Jacksonville, FL 32217 | |
| Phone # for sales: | 904-239-9564 |
| E-mail address: | lineartradingsys@gmail.com |
Traders' Resource Links | |
| Linear Trading Systems LLC has not added any product or service information to TRADERS' RESOURCE. | |
Click here for more information about our publications!
PRINT THIS ARTICLE

Request Information From Our Sponsors
- StockCharts.com, Inc.
- Candle Patterns
- Candlestick Charting Explained
- Intermarket Technical Analysis
- John Murphy on Chart Analysis
- John Murphy's Chart Pattern Recognition
- John Murphy's Market Message
- MurphyExplainsMarketAnalysis-Intermarket Analysis
- MurphyExplainsMarketAnalysis-Visual Analysis
- StockCharts.com
- Technical Analysis of the Financial Markets
- The Visual Investor
- VectorVest, Inc.
- Executive Premier Workshop
- One-Day Options Course
- OptionsPro
- Retirement Income Workshop
- Sure-Fire Trading Systems (VectorVest, Inc.)
- Trading as a Business Workshop
- VectorVest 7 EOD
- VectorVest 7 RealTime/IntraDay
- VectorVest AutoTester
- VectorVest Educational Services
- VectorVest OnLine
- VectorVest Options Analyzer
- VectorVest ProGraphics v6.0
- VectorVest ProTrader 7
- VectorVest RealTime Derby Tool
- VectorVest Simulator
- VectorVest Variator
- VectorVest Watchdog
