HOT TOPICS LIST
- MACD
- Fibonacci
- RSI
- Gann
- ADXR
- Stochastics
- Volume
- Triangles
- Futures
- Cycles
- Volatility
- ZIGZAG
- MESA
- Retracement
- Aroon
INDICATORS LIST
LIST OF TOPICS
PRINT THIS ARTICLE
by Mike Carr, CMT
Interest rates have fallen to historic lows and are now showing bubble-like extremes on the downside.
Position: Sell
Mike Carr, CMT
Mike Carr, CMT, is a member of the Market Technicians Association, and editor of the MTA's newsletter, Technically Speaking. He is also the author of "Smarter Investing in Any Economy: The Definitive Guide to Relative Strength Investing," and "Conquering the Divide: How to Use Economic Indicators to Catch Stock Market Trends."
PRINT THIS ARTICLE
BOLLINGER BANDS
10-Year Rates Look Oversold
09/06/11 09:11:39 AMby Mike Carr, CMT
Interest rates have fallen to historic lows and are now showing bubble-like extremes on the downside.
Position: Sell
| Bubbles are usually associated with large upside moves. Large gains that develop at an unsustainable pace are the classic idea of a bubble. Interest rates are meeting those criteria with their downward move, falling almost as fast as they did in 2008 as the depth of the financial crisis was becoming clear. |
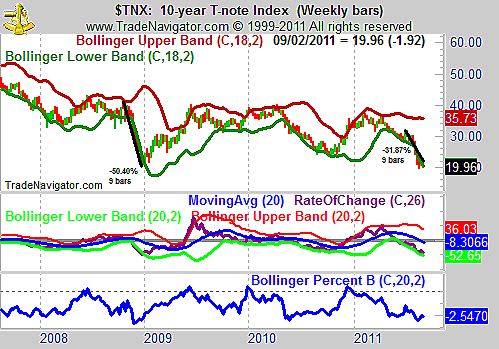
| Rates on the 10-year note are shown in Figure 1. They've fallen more than 30% in the past nine weeks. A faster move lower marked the height of the financial crisis in late 2008 as the rate fell 50% in a similar time. In this recent down move, the rate has fallen below its lower Bollinger Band as volatility increased. |

|
| FIGURE 1: 10-YEAR T-NOTES, WEEKLY. Ten-year rates have fallen more than 40% over the past 26 weeks and are at the lower Bollinger Band. |
| Graphic provided by: Trade Navigator. |
| |
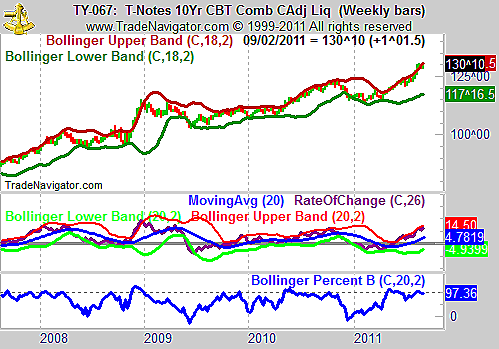
| Bonds show the opposite conditions as would be expected. In Figure 2, we can see that the price has moved up quickly. It's broken the upper Bollinger Band. |

|
| FIGURE 2: T-NOTES, WEEKLY. The futures contract on the 10-year note looks as overbought as interest rates look oversold. |
| Graphic provided by: Trade Navigator. |
| |
| Percent B on the notes has not confirmed a new high in 10-year prices. The next move in rates is likely to be higher, and that would mean it's time to short bonds. Fundamentals are mixed for the bond with a possible slowing economy and potential Fed easing pointing toward lower rates. However, the short-term charts show that any continuation in the downtrend would be likely after at least a consolidation. |
Mike Carr, CMT, is a member of the Market Technicians Association, and editor of the MTA's newsletter, Technically Speaking. He is also the author of "Smarter Investing in Any Economy: The Definitive Guide to Relative Strength Investing," and "Conquering the Divide: How to Use Economic Indicators to Catch Stock Market Trends."
| Website: | www.moneynews.com/blogs/MichaelCarr/id-73 |
| E-mail address: | marketstrategist@gmail.com |
Click here for more information about our publications!
PRINT THIS ARTICLE

Request Information From Our Sponsors
- StockCharts.com, Inc.
- Candle Patterns
- Candlestick Charting Explained
- Intermarket Technical Analysis
- John Murphy on Chart Analysis
- John Murphy's Chart Pattern Recognition
- John Murphy's Market Message
- MurphyExplainsMarketAnalysis-Intermarket Analysis
- MurphyExplainsMarketAnalysis-Visual Analysis
- StockCharts.com
- Technical Analysis of the Financial Markets
- The Visual Investor
- VectorVest, Inc.
- Executive Premier Workshop
- One-Day Options Course
- OptionsPro
- Retirement Income Workshop
- Sure-Fire Trading Systems (VectorVest, Inc.)
- Trading as a Business Workshop
- VectorVest 7 EOD
- VectorVest 7 RealTime/IntraDay
- VectorVest AutoTester
- VectorVest Educational Services
- VectorVest OnLine
- VectorVest Options Analyzer
- VectorVest ProGraphics v6.0
- VectorVest ProTrader 7
- VectorVest RealTime Derby Tool
- VectorVest Simulator
- VectorVest Variator
- VectorVest Watchdog
