

HOT TOPICS LIST
- MACD
- Fibonacci
- RSI
- Gann
- ADXR
- Stochastics
- Volume
- Triangles
- Futures
- Cycles
- Volatility
- ZIGZAG
- MESA
- Retracement
- Aroon
INDICATORS LIST
LIST OF TOPICS
PRINT THIS ARTICLE
by Koos van der Merwe
Eastman Kodak, once the king of the photograph, is now in the doldrums -- but is it?
Position: Accumulate
Koos van der Merwe
Has been a technical analyst since 1969, and has worked as a futures and options trader with First Financial Futures in Johannesburg, South Africa.
PRINT THIS ARTICLE
MOVING AVERAGES
Are You Looking For A Speculative Buy?
09/06/11 09:04:37 AMby Koos van der Merwe
Eastman Kodak, once the king of the photograph, is now in the doldrums -- but is it?
Position: Accumulate
| In the world of today, your cell phone has a camera that offers a variety of ways to take photos ranging from normal to panoramic to high definition, even offering a video camera, and the quality of photos improving with every new cellphone generation. Kodak films have become like Polaroid -- historical, except for those diehards who still believe that film is better than digital. Now, Kodak is once more in the headlines, but not for its film or cameras, but for its patents. Is it worth a buy? |
|
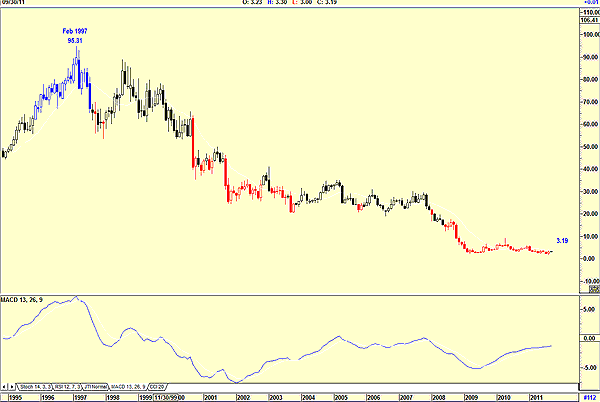
| FIGURE 1. EASTMAN KODAK, MONTHLY. Here's a monthly chart of Eastman Kodak. |
| Graphic provided by: AdvancedGET. |
| |
| Figure 1 is a monthly chart that shows how the price has fallen from a high of $95.31 on February 1997 to its present price of $3.19. The moving average convergence/divergence (MACD) indicator, although rising, is still looking weak. How low can this stock go? To answer this, we must look at the daily chart. |
|
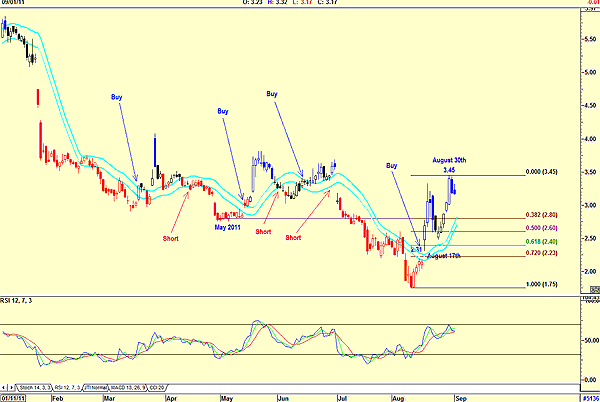
| FIGURE 2: EASTMAN KODAK, DAILY |
| Graphic provided by: AdvancedGET. |
| |
| The daily chart (Figure 2) shows the buy and short signals given by the JM internal band indicator. This indicator is a 15-period simple moving average offset 2% positive and 2% negative. We would use a preferred stop-loss to take one out when necessary. The chart gave a buy signal on August 17 at $2.31. The price moved up strongly, reaching a high of $3.45 by August 30, a comfortable return for those who had the courage to buy at $2.31. The relative strength index (RSI) has not yet reached overbought levels (above the 72 horizontal line) and with the present correction, the share could be a speculative buy. A Fibonacci retracement is suggesting a fall to $2.80 (38.2%) when the RSI confirms a sell signal. Note too that this level is the low of May 2011. In the meantime, those who own the stock should hold until a more definite sell signal or a stop-loss is breached. I would be a buyer of Eastman Kodak should the share fall to the $2.80 level or, for that matter, should the price rise above $3.45. But in either case, it would be a speculative short-term trade. |
Has been a technical analyst since 1969, and has worked as a futures and options trader with First Financial Futures in Johannesburg, South Africa.
| Address: | 3256 West 24th Ave |
| Vancouver, BC | |
| Phone # for sales: | 6042634214 |
| E-mail address: | petroosp@gmail.com |
Click here for more information about our publications!
PRINT THIS ARTICLE

Request Information From Our Sponsors
- VectorVest, Inc.
- Executive Premier Workshop
- One-Day Options Course
- OptionsPro
- Retirement Income Workshop
- Sure-Fire Trading Systems (VectorVest, Inc.)
- Trading as a Business Workshop
- VectorVest 7 EOD
- VectorVest 7 RealTime/IntraDay
- VectorVest AutoTester
- VectorVest Educational Services
- VectorVest OnLine
- VectorVest Options Analyzer
- VectorVest ProGraphics v6.0
- VectorVest ProTrader 7
- VectorVest RealTime Derby Tool
- VectorVest Simulator
- VectorVest Variator
- VectorVest Watchdog
- StockCharts.com, Inc.
- Candle Patterns
- Candlestick Charting Explained
- Intermarket Technical Analysis
- John Murphy on Chart Analysis
- John Murphy's Chart Pattern Recognition
- John Murphy's Market Message
- MurphyExplainsMarketAnalysis-Intermarket Analysis
- MurphyExplainsMarketAnalysis-Visual Analysis
- StockCharts.com
- Technical Analysis of the Financial Markets
- The Visual Investor