

HOT TOPICS LIST
- MACD
- Fibonacci
- RSI
- Gann
- ADXR
- Stochastics
- Volume
- Triangles
- Futures
- Cycles
- Volatility
- ZIGZAG
- MESA
- Retracement
- Aroon
INDICATORS LIST
LIST OF TOPICS
PRINT THIS ARTICLE
by Mike Carr, CMT
Almost every stock decline of 5% leads to the question about whether a new bear market is under way. The steep drop in August prompts that question once again.
Position: Buy
Mike Carr, CMT
Mike Carr, CMT, is a member of the Market Technicians Association, and editor of the MTA's newsletter, Technically Speaking. He is also the author of "Smarter Investing in Any Economy: The Definitive Guide to Relative Strength Investing," and "Conquering the Divide: How to Use Economic Indicators to Catch Stock Market Trends."
PRINT THIS ARTICLE
CHART ANALYSIS
Was That A Bear Market?
09/02/11 09:04:06 AMby Mike Carr, CMT
Almost every stock decline of 5% leads to the question about whether a new bear market is under way. The steep drop in August prompts that question once again.
Position: Buy
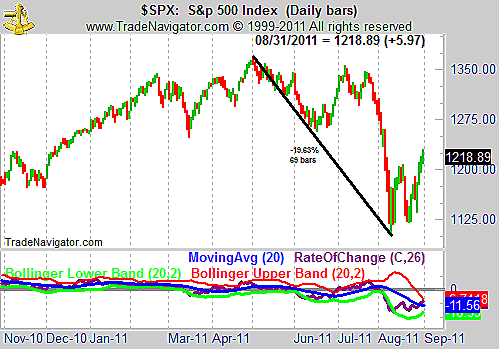
| Stocks fell more than 19% from their highs, using the Standard & Poor's 500 as the benchmark (Figure 1). The high was reached in May. That's close, but some purists insist that it takes a 20% decline for a bear market. For them, this wasn't a bear market, although many investors seem to have become permanently bearish and are always assuming that a big decline is just around the corner. |
|
| FIGURE 1: SPX, DAILY. The S&P 500 rate of change indicator looks bullish as prices rebound from their recent sharp decline. |
| Graphic provided by: Trade Navigator. |
| |
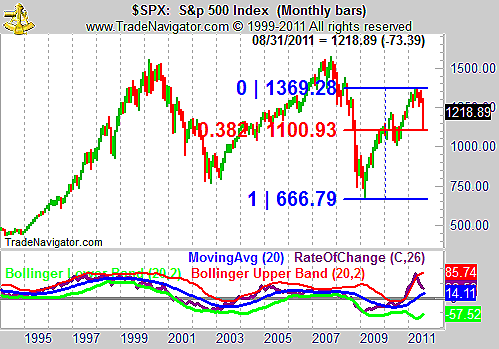
| From a longer-term perspective (Figure 2), the monthly chart shows that the recent down move in the S&P 500 was simply a Fibonacci retracement, and the decline stopped near the 38.2% level. This would be considered healthy for a bull market. |
|
| FIGURE 2: SPX, MONTHLY. The ROC is now close to a neutral reading after becoming extremely overbought on the monthly chart of the S&P 500. This indicator is now supportive of a bullish move in the S&P 500. |
| Graphic provided by: Trade Navigator. |
| |
| Ned Davis Research defines a bear market as a 30% drop in the Dow Jones Industrial Average (DJIA) over the course of 50 days, or a 13% decline in the average after 145 days. By that measure, the most recent decline also fails to be classified as a bear market. |
| With momentum supporting further price strength, it seems like the August swoon in stocks was a retracement in an ongoing bull market. |
Mike Carr, CMT, is a member of the Market Technicians Association, and editor of the MTA's newsletter, Technically Speaking. He is also the author of "Smarter Investing in Any Economy: The Definitive Guide to Relative Strength Investing," and "Conquering the Divide: How to Use Economic Indicators to Catch Stock Market Trends."
| Website: | www.moneynews.com/blogs/MichaelCarr/id-73 |
| E-mail address: | marketstrategist@gmail.com |
Click here for more information about our publications!
Comments
Date:�09/02/11Rank:�3Comment:�

Request Information From Our Sponsors
- StockCharts.com, Inc.
- Candle Patterns
- Candlestick Charting Explained
- Intermarket Technical Analysis
- John Murphy on Chart Analysis
- John Murphy's Chart Pattern Recognition
- John Murphy's Market Message
- MurphyExplainsMarketAnalysis-Intermarket Analysis
- MurphyExplainsMarketAnalysis-Visual Analysis
- StockCharts.com
- Technical Analysis of the Financial Markets
- The Visual Investor
- VectorVest, Inc.
- Executive Premier Workshop
- One-Day Options Course
- OptionsPro
- Retirement Income Workshop
- Sure-Fire Trading Systems (VectorVest, Inc.)
- Trading as a Business Workshop
- VectorVest 7 EOD
- VectorVest 7 RealTime/IntraDay
- VectorVest AutoTester
- VectorVest Educational Services
- VectorVest OnLine
- VectorVest Options Analyzer
- VectorVest ProGraphics v6.0
- VectorVest ProTrader 7
- VectorVest RealTime Derby Tool
- VectorVest Simulator
- VectorVest Variator
- VectorVest Watchdog