HOT TOPICS LIST
- MACD
- Fibonacci
- RSI
- Gann
- ADXR
- Stochastics
- Volume
- Triangles
- Futures
- Cycles
- Volatility
- ZIGZAG
- MESA
- Retracement
- Aroon
INDICATORS LIST
LIST OF TOPICS
PRINT THIS ARTICLE
by Donald W. Pendergast, Jr.
Not only have shares of Bristol Myers Squibb rebounded nicely from August 2011's panic selling, they've also managed to make a fresh multiyear high.
Position: N/A
Donald W. Pendergast, Jr.
Donald W. Pendergast is a financial markets consultant who offers specialized services to stock brokers and high net worth individuals who seek a better bottom line for their portfolios.
PRINT THIS ARTICLE
MOMENTUM
Bristol Myers Squibb New Highs
09/01/11 03:51:01 PMby Donald W. Pendergast, Jr.
Not only have shares of Bristol Myers Squibb rebounded nicely from August 2011's panic selling, they've also managed to make a fresh multiyear high.
Position: N/A
| Bristol Myers Squibb (BMY) shares aren't necessarily the most volatile things in the stock market, but they still have managed to nearly double in price since puttting in a major low back in October 2008. Since then, the stock has traced out a very strong pattern of higher swing highs and lows on a variety of time frames (daily/weekly/monthly), fully confirming the validity of the uptrend. Even better, the stock is now sitting at its highest price since November 2, 2007 -- meaning that it is definitely on the radar screens of institutional traders around the globe. Here's a closer look now. |

|
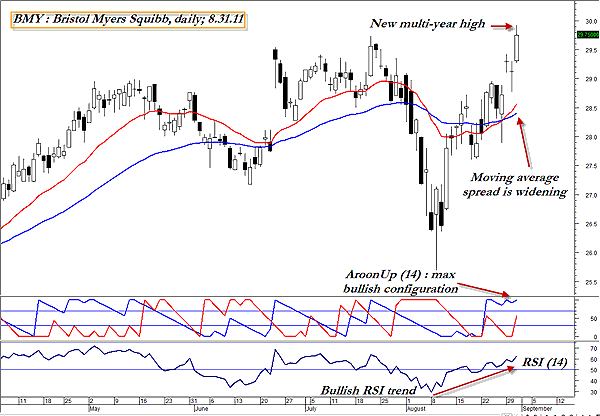
| FIGURE 1: BMY, DAILY. While it's always tempting to declare that a stock has just gone too far, too fast, it's still usually best to let the charts make the final decsion for you. This chart in BMY seems to suggest that a potentially profitable covered-call opportunity awaits moderately skilled traders and investors. |
| Graphic provided by: MetaStock. |
| |
| Figure 1 is the daily chart for BMY, one on which I've overlaid a moving average series (the 20- and 50-period exponential moving average pair), the 14-period Aroon indicator, and the 14-period relative strength index (RSI). Taken as a unit, they are also confirming the trend strength: the AroonUp (blue line of the Aroon indicator below the chart window) is now at 100, the maximum possible bullish reading, even as the 14-period RSI is coming in at 62.29 and rising -- which is also clearly in the bullish camp. The moving average spread is also widening, with both individual averages displaying bullish angles of attack (they're both rising). Generally speaking, this is a very healthy-looking stock, one that conservative investors and traders might consider using as part of a covered call (buy-write) strategy. Look for the near-term, at-the-money calls to sell against every 100 shares owned of BMY, and then manage the trade with perhaps a 20- or 50-period daily exponential moving average (EMA) that you can use as a trailing stop for the entire position. |
| Aggressive traders will probably want to drill down to a 30- or even 60-minute time frame, looking for low-risk entry areas near zones of significant support such as Fibonacci confluences, major moving averages, and/or intraday floor trader pivot points. Look to make hay while the sun shines and then consider closing out such long trades upon breaks of significant uptrend lines, trailing stops, or moving averages. Aggressive or conservative, you're almost certain to come up with a way to play the ongoing bullish trend in shares of BMY. Size your positions wisely and use all that you've learned here at Traders.com Advantage to help you make the most of every trade you put on. |
Donald W. Pendergast is a financial markets consultant who offers specialized services to stock brokers and high net worth individuals who seek a better bottom line for their portfolios.
| Title: | Writer, market consultant |
| Company: | Linear Trading Systems LLC |
| Jacksonville, FL 32217 | |
| Phone # for sales: | 904-239-9564 |
| E-mail address: | lineartradingsys@gmail.com |
Traders' Resource Links | |
| Linear Trading Systems LLC has not added any product or service information to TRADERS' RESOURCE. | |
Click here for more information about our publications!
PRINT THIS ARTICLE

Request Information From Our Sponsors
- StockCharts.com, Inc.
- Candle Patterns
- Candlestick Charting Explained
- Intermarket Technical Analysis
- John Murphy on Chart Analysis
- John Murphy's Chart Pattern Recognition
- John Murphy's Market Message
- MurphyExplainsMarketAnalysis-Intermarket Analysis
- MurphyExplainsMarketAnalysis-Visual Analysis
- StockCharts.com
- Technical Analysis of the Financial Markets
- The Visual Investor
- VectorVest, Inc.
- Executive Premier Workshop
- One-Day Options Course
- OptionsPro
- Retirement Income Workshop
- Sure-Fire Trading Systems (VectorVest, Inc.)
- Trading as a Business Workshop
- VectorVest 7 EOD
- VectorVest 7 RealTime/IntraDay
- VectorVest AutoTester
- VectorVest Educational Services
- VectorVest OnLine
- VectorVest Options Analyzer
- VectorVest ProGraphics v6.0
- VectorVest ProTrader 7
- VectorVest RealTime Derby Tool
- VectorVest Simulator
- VectorVest Variator
- VectorVest Watchdog
