HOT TOPICS LIST
- MACD
- Fibonacci
- RSI
- Gann
- ADXR
- Stochastics
- Volume
- Triangles
- Futures
- Cycles
- Volatility
- ZIGZAG
- MESA
- Retracement
- Aroon
INDICATORS LIST
LIST OF TOPICS
PRINT THIS ARTICLE
by Koos van der Merwe
The consumer confidence index has dropped, and stock prices have fallen. When do you get back in?
Position: Accumulate
Koos van der Merwe
Has been a technical analyst since 1969, and has worked as a futures and options trader with First Financial Futures in Johannesburg, South Africa.
PRINT THIS ARTICLE
CYCLES
When To Buy
08/31/11 09:02:21 AMby Koos van der Merwe
The consumer confidence index has dropped, and stock prices have fallen. When do you get back in?
Position: Accumulate
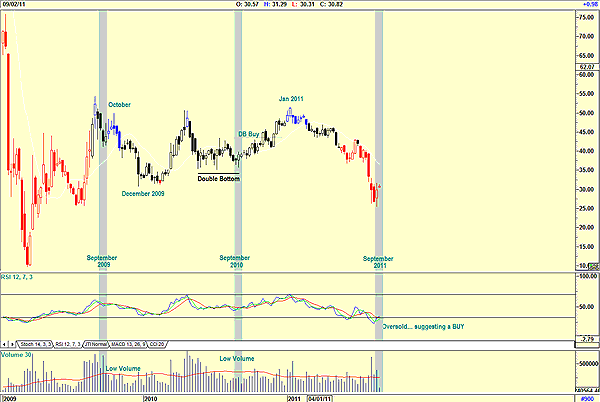
| When do you get back in? That is the question almost everyone asks. September is known for being the quietest month of the year. Do you wait for September before you look for bottoms and start buying? Admittedly, it is a good strategy, and the week before Labor Day is a good week to take a holiday. Volume should be low, and opportunities could exist. Figure 1 is a weekly chart of Citigroup (C). I chose this one to analyze because it is a bank, and all banks have been hit badly with shares falling dramatically, and as the economy starts recovering, those banks that solve their problems more rapidly than others are those whose share prices will recover the fastest. I believe Citigroup is one of those banks. |

|
| FIGURE 1: CITIGROUP, WEEKLY. Weekly chart of C highlighting the month of September. |
| Graphic provided by: AdvancedGET. |
| |
| My chart shows September 2009 to 2010. September 2010's volume was light, as expected, and shows share prices forming a double bottom before rising strongly into January 2011. However, this did not happen in 2009, where the share price weakened during September on strong volume, rose in October on weaker volume, and then fell into December 2009 on volume that was below average. Obviously, this was because of the general bearish sentiment as the bank sought to solve its economic problems. Is it time to buy Citigroup now? The relative strength index (RSI) seems to think so, and with September around the corner and ignoring all fundamentals, it does look tempting. |

|
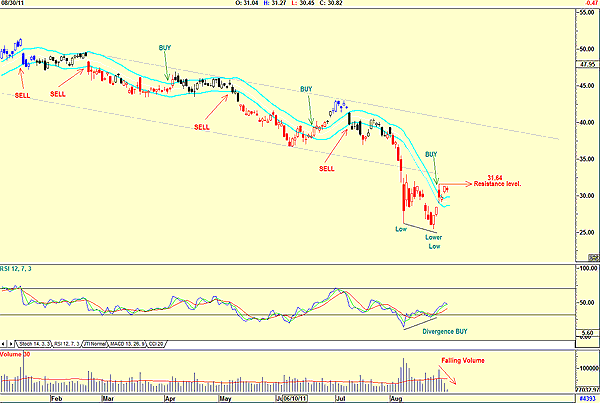
| FIGURE 2: CITIGROUP, DAILY This daily chart of C suggests a buy signal. |
| Graphic provided by: AdvancedGET. |
| |
| To help with the decision, I looked at the daily chart using the conservative JM internal band as a buy/sell indicator (Figure 2). The JM internal band indicator is a 15-period simple moving average (SMA) offset 2% positive and -2% negative. The chart shows the buy and sell signals given over the past months. At the moment, in line with the RSI divergence buy signal, the indicator has given a buy, with a resistance level of $31.64, the recent pivot point. Note how volume has been falling as September approached. With the price falling on falling volume, a buy is suggested. Finally, also note that an inverse head & shoulders looks as if it could be forming. Should the price fall further and then begin to rise again, this will be confirmed, allowing us the opportunity to determine a target. Buying during September, usually the quietest month of the year, can be a good decision to make, but not always. To assist in that decision, a conservative indicator can assist in your decision making. |
Has been a technical analyst since 1969, and has worked as a futures and options trader with First Financial Futures in Johannesburg, South Africa.
| Address: | 3256 West 24th Ave |
| Vancouver, BC | |
| Phone # for sales: | 6042634214 |
| E-mail address: | petroosp@gmail.com |
Click here for more information about our publications!
PRINT THIS ARTICLE

|

Request Information From Our Sponsors
- StockCharts.com, Inc.
- Candle Patterns
- Candlestick Charting Explained
- Intermarket Technical Analysis
- John Murphy on Chart Analysis
- John Murphy's Chart Pattern Recognition
- John Murphy's Market Message
- MurphyExplainsMarketAnalysis-Intermarket Analysis
- MurphyExplainsMarketAnalysis-Visual Analysis
- StockCharts.com
- Technical Analysis of the Financial Markets
- The Visual Investor
- VectorVest, Inc.
- Executive Premier Workshop
- One-Day Options Course
- OptionsPro
- Retirement Income Workshop
- Sure-Fire Trading Systems (VectorVest, Inc.)
- Trading as a Business Workshop
- VectorVest 7 EOD
- VectorVest 7 RealTime/IntraDay
- VectorVest AutoTester
- VectorVest Educational Services
- VectorVest OnLine
- VectorVest Options Analyzer
- VectorVest ProGraphics v6.0
- VectorVest ProTrader 7
- VectorVest RealTime Derby Tool
- VectorVest Simulator
- VectorVest Variator
- VectorVest Watchdog
