HOT TOPICS LIST
- MACD
- Fibonacci
- RSI
- Gann
- ADXR
- Stochastics
- Volume
- Triangles
- Futures
- Cycles
- Volatility
- ZIGZAG
- MESA
- Retracement
- Aroon
INDICATORS LIST
LIST OF TOPICS
PRINT THIS ARTICLE
by Chaitali Mohile
The technical chart of Metlife shows huge bearish pressure.
Position: N/A
Chaitali Mohile
Active trader in the Indian stock markets since 2003 and a full-time writer. Trading is largely based upon technical analysis.
PRINT THIS ARTICLE
TECHNICAL ANALYSIS
Does Metlife Have More Downside?
08/31/11 01:29:44 PMby Chaitali Mohile
The technical chart of Metlife shows huge bearish pressure.
Position: N/A
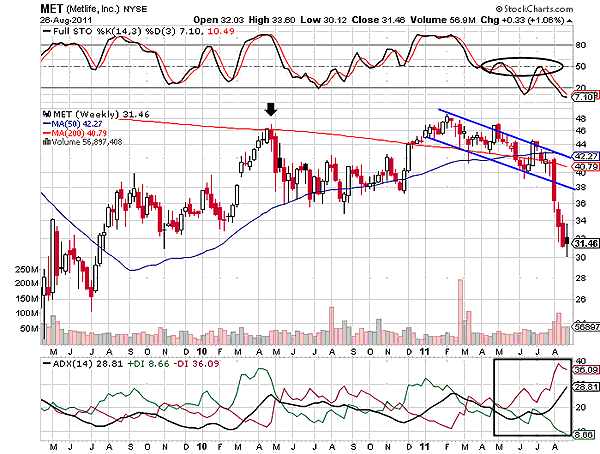
| The 200-day moving average (MA) acts as a major resistance of Metlife (MET). In early 2011, MET formed a top after converting the MA resistance to support. The stock was unable to sustain at a new high. In 2010, the stock failed to breach the moving average resistance and continued to rally under bearish pressure. The stock consolidated with the support of the 50-day moving average (MA). The average directional index (ADX) (14) in Figure 1 was unstable due to the fluctuating buying and selling pressures. An uptrend was developing during the 200-day MA bullish breakout. However, the weak buying pressure forced the ADX to reverse. |
| We can see in Figure 1 the MET began descending from $48, forming lower highs and lower lows. A new bearish rally formed a descending channel on its weekly time frame in Figure 1. Gradually, the channel slipped below the 200-day MA support, indicating an additional bearish force for MET. Technically, the breaching of this major MA support suggests robust corrective phase for the stock. |

|
| FIGURE 1: MET, WEEKLY. After breaching the lower trendline support of the descending channel, the bearish rally of the stock turned stronger. |
| Graphic provided by: StockCharts.com. |
| |
| The full stochastic (14,3,3) formed a double top at the center line near 50 levels in Figure 1. The double top is a bearish reversal formation that initiates a fresh bearish rally. The ADX (14) developed a fresh downtrend for MET. Therefore, the rally turned stronger as the 200-day MA and the lower trendline support were violated. The stock has plunged eight points from the breakout point at 38 levels, dragging the stochastic oscillator to a highly oversold area below 10. This momentum indicator can remain oversold for a longer period; therefore, we cannot anticipate a pullback. In addition, the selling pressure is sharply surging. In such a situation, MET is likely to lose a few more points. |

|
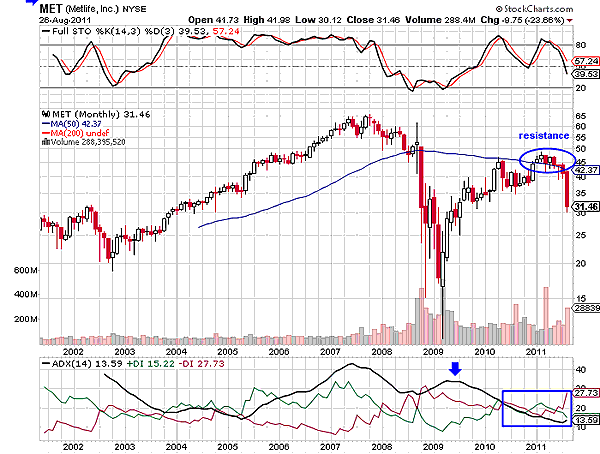
| FIGURE 2: MET, MONTHLY. The 50-day MA suppressed the relief rally of the stock. |
| Graphic provided by: StockCharts.com. |
| |
| The 50-day MA in the monthly chart in Figure 2 restricted the pullback rally of MET. The rally reversed immediately after hitting the MA resistance. After forming the double top in an overbought region, the oscillator was ready to plunge below 50 levels. The descending downtrend has weakened as the ADX (14) moved below 15 levels, but the converging selling and buying pressures would trigger high volatility in the bearish rally. As a result, MET would continue its downside rally. Since MET has already dropped 15 points, the correction would be slow and limited. |
| To conclude, MET has limited downside. The stock has its next support at $25, which would protect the price rally from the additional loss. |
Active trader in the Indian stock markets since 2003 and a full-time writer. Trading is largely based upon technical analysis.
| Company: | Independent |
| Address: | C1/3 Parth Indraprasth Towers. Vastrapur |
| Ahmedabad, Guj 380015 | |
| E-mail address: | chaitalimohile@yahoo.co.in |
Traders' Resource Links | |
| Independent has not added any product or service information to TRADERS' RESOURCE. | |
Click here for more information about our publications!
PRINT THIS ARTICLE

|

Request Information From Our Sponsors
- StockCharts.com, Inc.
- Candle Patterns
- Candlestick Charting Explained
- Intermarket Technical Analysis
- John Murphy on Chart Analysis
- John Murphy's Chart Pattern Recognition
- John Murphy's Market Message
- MurphyExplainsMarketAnalysis-Intermarket Analysis
- MurphyExplainsMarketAnalysis-Visual Analysis
- StockCharts.com
- Technical Analysis of the Financial Markets
- The Visual Investor
- VectorVest, Inc.
- Executive Premier Workshop
- One-Day Options Course
- OptionsPro
- Retirement Income Workshop
- Sure-Fire Trading Systems (VectorVest, Inc.)
- Trading as a Business Workshop
- VectorVest 7 EOD
- VectorVest 7 RealTime/IntraDay
- VectorVest AutoTester
- VectorVest Educational Services
- VectorVest OnLine
- VectorVest Options Analyzer
- VectorVest ProGraphics v6.0
- VectorVest ProTrader 7
- VectorVest RealTime Derby Tool
- VectorVest Simulator
- VectorVest Variator
- VectorVest Watchdog
