HOT TOPICS LIST
- MACD
- Fibonacci
- RSI
- Gann
- ADXR
- Stochastics
- Volume
- Triangles
- Futures
- Cycles
- Volatility
- ZIGZAG
- MESA
- Retracement
- Aroon
INDICATORS LIST
LIST OF TOPICS
PRINT THIS ARTICLE
by Matt Blackman
Every once in a while you see a chart that really jumps out at you.
Position: N/A
Matt Blackman
Matt Blackman is a full-time technical and financial writer and trader. He produces corporate and financial newsletters, and assists clients in getting published in the mainstream media. He is the host of TradeSystemGuru.com. Matt has earned the Chartered Market Technician (CMT) designation. Find out what stocks and futures Matt is watching on Twitter at www.twitter.com/RatioTrade
PRINT THIS ARTICLE
Rhyming Markets Tell A Troubling Tale
08/30/11 02:54:26 PMby Matt Blackman
Every once in a while you see a chart that really jumps out at you.
Position: N/A
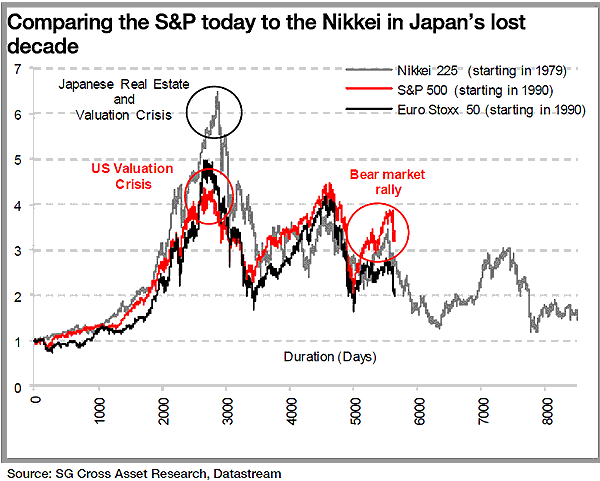
| Once in a while something jumps out at you. That happened when I saw this chart (Figure 1). Charts comparing the Standard & Poor's 500 from its peak in 2000 with the Nikkei 225 peak in 1989 have appeared on a number of websites. But Figure 1 showed the Nikkei, the S&P 500, and the Euro Stoxx Index from the beginning of their runups, covering a complete cycle. As Mark Twain once quipped, history doesn't repeat itself -- sometimes it rhymes. As we see, although the movements of the three indexes are not identical, they certainly do rhyme, and the correlation is obvious. If the correlation holds, it has ominous implications for stock prices over the next few years. |

|
| FIGURE 1: COMPARISONS. Chart comparing the S&P 500 and Euro Stoxx indexes starting in 1990 with the Nikkei 225 starting in 1979. |
| Graphic provided by: Chart courtesy of Societe Generale.. |
| |
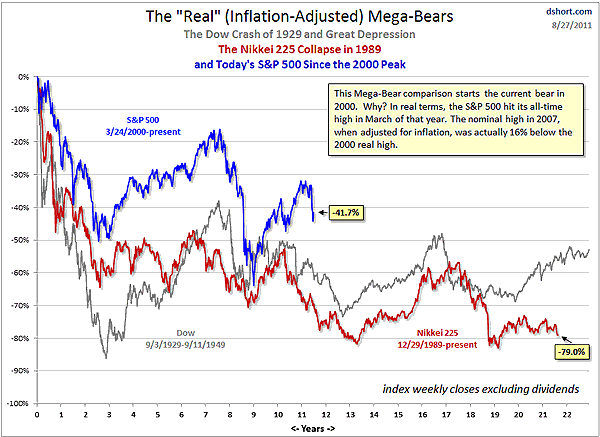
| Here is the more common perspective from the respective tops of the S&P 500 and the Nikkei 225 from their respective peaks in 2000 and 1989. Since the peaks unfolded in slightly different ways with different rates of change, the correlation appears less strong. However, note that the lows are relatively close to one another in a relationship that implies that the S&P is only halfway to the bottom over the next few years. |

|
| FIGURE 2: CORRELATION. Chart showing the correlation between the Nikkei 225 from 1989, the Dow Jones Industrial Average (from 1929), and the S&P 500 index (from 2000). |
| Graphic provided by: http://advisorperspectives.com/dshort/charts/marke. |
| |
| Bear market rallies are often powerful for the simple reason that no matter what the reality, investor optimism, fueled by increasingly attractive valuations when stock prices are falling, is always present. And this human characteristic makes shorting in a bear market a risky proposition. Even if you are right about the overall direction, margin calls during countertrend rallies can quickly put you out of business. |
| The flipside can be equally expensive, and that is continually attempting to go long during a bear market. Either way, it's important to not marry any position, look for confirmation in the way of trendline breaks before entering a trade, and never second-guess stop-losses. |
| Both charts demonstrate the risks of getting caught up playing the short term while ignoring the view from 30,000 feet. No matter what your time frame, those with a realistic view of markets and who are prepared to quickly change direction as conditions dictate stand the best chance of succeeding in the trading game. |
Matt Blackman is a full-time technical and financial writer and trader. He produces corporate and financial newsletters, and assists clients in getting published in the mainstream media. He is the host of TradeSystemGuru.com. Matt has earned the Chartered Market Technician (CMT) designation. Find out what stocks and futures Matt is watching on Twitter at www.twitter.com/RatioTrade
| Company: | TradeSystemGuru.com |
| Address: | Box 2589 |
| Garibaldi Highlands, BC Canada | |
| Phone # for sales: | 604-898-9069 |
| Fax: | 604-898-9069 |
| Website: | www.tradesystemguru.com |
| E-mail address: | indextradermb@gmail.com |
Traders' Resource Links | |
| TradeSystemGuru.com has not added any product or service information to TRADERS' RESOURCE. | |
Click here for more information about our publications!
Comments
Date: 08/31/11Rank: 5Comment:

|

Request Information From Our Sponsors
- StockCharts.com, Inc.
- Candle Patterns
- Candlestick Charting Explained
- Intermarket Technical Analysis
- John Murphy on Chart Analysis
- John Murphy's Chart Pattern Recognition
- John Murphy's Market Message
- MurphyExplainsMarketAnalysis-Intermarket Analysis
- MurphyExplainsMarketAnalysis-Visual Analysis
- StockCharts.com
- Technical Analysis of the Financial Markets
- The Visual Investor
- VectorVest, Inc.
- Executive Premier Workshop
- One-Day Options Course
- OptionsPro
- Retirement Income Workshop
- Sure-Fire Trading Systems (VectorVest, Inc.)
- Trading as a Business Workshop
- VectorVest 7 EOD
- VectorVest 7 RealTime/IntraDay
- VectorVest AutoTester
- VectorVest Educational Services
- VectorVest OnLine
- VectorVest Options Analyzer
- VectorVest ProGraphics v6.0
- VectorVest ProTrader 7
- VectorVest RealTime Derby Tool
- VectorVest Simulator
- VectorVest Variator
- VectorVest Watchdog
