HOT TOPICS LIST
- MACD
- Fibonacci
- RSI
- Gann
- ADXR
- Stochastics
- Volume
- Triangles
- Futures
- Cycles
- Volatility
- ZIGZAG
- MESA
- Retracement
- Aroon
INDICATORS LIST
LIST OF TOPICS
PRINT THIS ARTICLE
by Dennis D. Peterson
A new tool makes the analysis of future pivot peaks or valleys easier.
Position: N/A
Dennis D. Peterson
Market index trading on a daily basis.
PRINT THIS ARTICLE
SWING CHART
Swing Prediction Revisited
04/16/02 09:41:05 AMby Dennis D. Peterson
A new tool makes the analysis of future pivot peaks or valleys easier.
Position: N/A
| In my previous article, Swing Prediction (11/19/2001), I concluded by saying I would explore developing a tool that would make calculations more visible. With TS Support (http://www.tssupport.com) providing an enormous amount of code and patience, you can now see the product working. The code is written for ProSuite 2000i. |
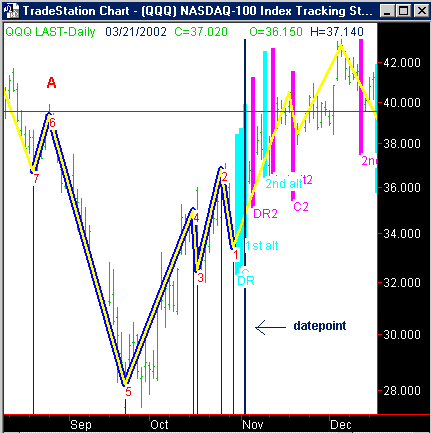
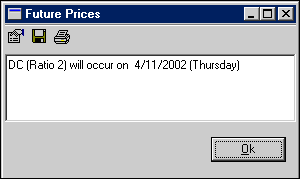
| The software is designed to handle all of the testing I wanted to see in the previous article. You can set percentage change for ZigZag to control the definition of pivot peaks and valleys and you have a threshold available to ignore swings of less than or equal to a "threshold" number of bars. Each of the swings, DR, first alternate, second alternate, DC and C can have two ratios assigned. The defaults are set to the ratio values used in the spreadsheets of the previous article. In addition, while the spreadsheet wouldn't exclude holidays in counting, this algorithm only counts bars that are trading bars, and leaves out holidays. In Figure 1 below the date of 11/02/2001 is chosen to backtest combinations of ZigZag percentage and threshold. By the way, if you choose a date like 11/11/2001, which is a Sunday, the software will change the date to 11/12/2001. The inputs used in Figure 1 are: datepoint: date to make swing predictions from (long white vertical line at 11/02/2001), wavepcnt: the percentage change for the ZigZag calculation (5% is used), color: color of the ZigZag line (yellow, and when surrounded by blue it is used in the calculations, and if surrounded by red, ignored - unless it is the first swing which is always included), line thickness, set to one, and then whether or not you want to use DR, first alternate, second alternate, DC and C in your calculations, which in this case are all set to true, the two values of the ratios used for DR, first and second alternates, DC and C, and the threshold bar count, to allow you to ignore small swings - the default is five and zero is being used in Figure 1. As you can see each swing is numbered. The vertical white lines going down meet with text that tells you how many bars are in each swing. Vertical lines of two different colors indicate whether the future dates are for the first set of ratios (Figure 1: blue vertical lines) or the second set of ratios (Figure 1: magenta vertical lines). Each of the vertical lines is also labeled. For example DR2 is the date calculated by multiplying DR by the second ratio. If a date is beyond an x-axis scale then a window of future dates is created (Figure 2). |

|
| Figure 1: QQQ Daily Price Overlayed With Pivot Predictor. The vertical blue and magenta bars are the future dates calculated by multiplying swing length times Fibonacci ratios. The blue outline of yellow ZigZag lines indicates the swings used in the calculation. Swings and combinations are used to create DR, first alternate, second alternate, DC and C per the past Traders Advantage article “Swing Prediction”, 11/19/2001. |
| Graphic provided by: TradeStation. |
| Graphic provided by: Data Vendor: CSI Data. |
| |
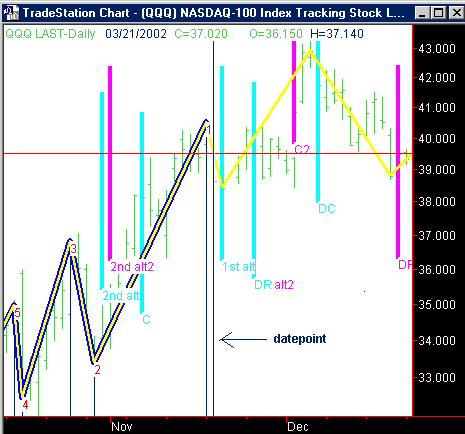
 Figure 2: Window to show future dates not displayed on chart. I initially started backtesting with the well-defined pivot valley of 9/24/2001. I chose a date shortly after 9/24 to start the calculations. I found that predicting the long upswing following 9/24 was not possible. So I moved the datepoint to 11/02/2001 so that the earlier swings could be used. From this, five dates were projected in the future as indicated by the blue and magenta vertical lines. One of the five dates that came up was 11/20/2001 as the next pivot. This was using a 5% ZigZag. I changed to a 4% ZigZag and 11/20/2001 again came up as a possible date. I drew a red horizontal line from a previous pivot (Figure 1: point A) because it is the likely price at which QQQ will turn again. The closer price rises to A the greater the odds that 11/20/2001 is a pivot date. The date of the actual pivot was 11/19/2001. Moving the datepoint further forward in time along an existing swing will make no difference in the prediction since the past history of swings remains the same - the only way to change the predictions is to change the ratios, the ZigZag percentage, which will change the swings, or change the threshold.  Figure 3: QQQ Daily Price Overlayed With Pivot Predictor. Datepoint is 11/20/2001 and is the dark blue vertical line running from the top to the bottom of the chart. The first alternate is a direct hit on the pivot date of 11/21/2001, and while the first alternate using the second ratio and DR using the first ratio look like a miss at 11/27/2001, if you look at the data closely you will see this is where price went sideways and then down--almost a legitimate hit. C2 and DR bracket the peak at 12/06/2001 and DR2 at 12/20/2001 misses the valley by one day. Obviously there is more work to be done, but there does seem to be some promising aspects to this tool. Initially I have found that if you have a change in trend direction, you'll need to let some of the initial swings develop for the tool to work better. Looking at a datepoint of 11/20 in the short uptrend of QQQ (Figure 3) you see that it does a better job of hitting the dates of future pivots. |
| The code is available at www.tssupport.com. Enjoy! |
Market index trading on a daily basis.
| Title: | Staff Writer |
| Company: | Technical Analysis, Inc. |
| Address: | 4757 California Ave SW |
| Seattle, WA 98116-4499 | |
| Phone # for sales: | 206 938 0570 |
| Fax: | 206 938 1307 |
| Website: | www.traders.com |
| E-mail address: | dpeterson@traders.com |
Traders' Resource Links | |
| Charting the Stock Market: The Wyckoff Method -- Books | |
| Working-Money.com -- Online Trading Services | |
| Traders.com Advantage -- Online Trading Services | |
| Technical Analysis of Stocks & Commodities -- Publications and Newsletters | |
| Working Money, at Working-Money.com -- Publications and Newsletters | |
| Traders.com Advantage -- Publications and Newsletters | |
| Professional Traders Starter Kit -- Software | |
Click here for more information about our publications!
Comments
Date: 04/19/02Rank: 4Comment: sorry but i can t finde the code anywhere on the www.tssupport.com:)

Request Information From Our Sponsors
- StockCharts.com, Inc.
- Candle Patterns
- Candlestick Charting Explained
- Intermarket Technical Analysis
- John Murphy on Chart Analysis
- John Murphy's Chart Pattern Recognition
- John Murphy's Market Message
- MurphyExplainsMarketAnalysis-Intermarket Analysis
- MurphyExplainsMarketAnalysis-Visual Analysis
- StockCharts.com
- Technical Analysis of the Financial Markets
- The Visual Investor
- VectorVest, Inc.
- Executive Premier Workshop
- One-Day Options Course
- OptionsPro
- Retirement Income Workshop
- Sure-Fire Trading Systems (VectorVest, Inc.)
- Trading as a Business Workshop
- VectorVest 7 EOD
- VectorVest 7 RealTime/IntraDay
- VectorVest AutoTester
- VectorVest Educational Services
- VectorVest OnLine
- VectorVest Options Analyzer
- VectorVest ProGraphics v6.0
- VectorVest ProTrader 7
- VectorVest RealTime Derby Tool
- VectorVest Simulator
- VectorVest Variator
- VectorVest Watchdog
