HOT TOPICS LIST
- MACD
- Fibonacci
- RSI
- Gann
- ADXR
- Stochastics
- Volume
- Triangles
- Futures
- Cycles
- Volatility
- ZIGZAG
- MESA
- Retracement
- Aroon
INDICATORS LIST
LIST OF TOPICS
PRINT THIS ARTICLE
by Austin Passamonte
Here's the technical outlook for ES and YM futures markets.
Position: N/A
Austin Passamonte
Austin is a private trader who trades emini stock index futures intraday. He currently trades various futures markets from home in addition to managing a trader's educational forum
PRINT THIS ARTICLE
TECHNICAL ANALYSIS
Bear Break?
08/30/11 10:55:38 AMby Austin Passamonte
Here's the technical outlook for ES and YM futures markets.
Position: N/A
| After endless months of rock-bottom volatility near multiyear market highs, the wheels came off that rally with incredible speed. Months of upside gain were erased in days and sometimes mere hours of relentless selling. Markets have relaxed in sideways fashion since then, which is likely the calm before the next storm. |

|
| FIGURE 1: ES, WEEKLY |
| Graphic provided by: eSignal. |
| |
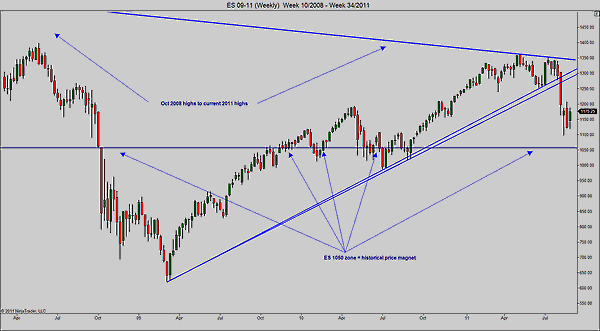
| The weekly chart view of the ES (Figure 1) shows where an inside bar from last week held previous lows and remained below prior highs. The classic consolidation bar that had traders the world over watching the prior week now has a high/low range for its pending breakout or breakdown potential. |

|
| FIGURE 2: ES, DAILY |
| Graphic provided by: eSignal. |
| |
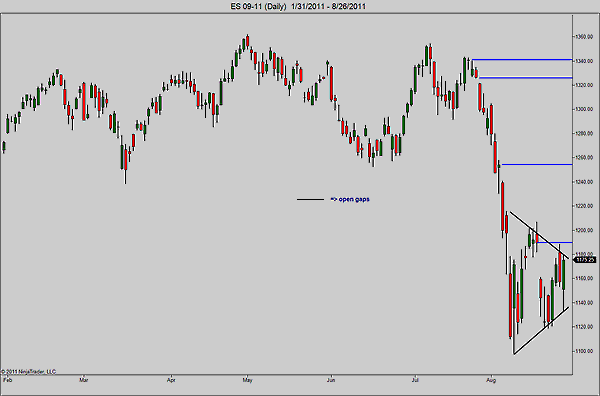
| Dialed down to the daily chart (Figure 2) shows a clearer inside view of the three-week wedge. Several open gaps remain magnetic above, the nearest being 1190+ and then 1250+ zones within (relatively) easy reach. A subsequent breakdown below 1140s and especially 1120s may have ushered in a retest of the 1050s lows from early August in premarket action, which have not been tested since. |

|
| FIGURE 3: YM, WEEKLY |
| Graphic provided by: eSignal. |
| |
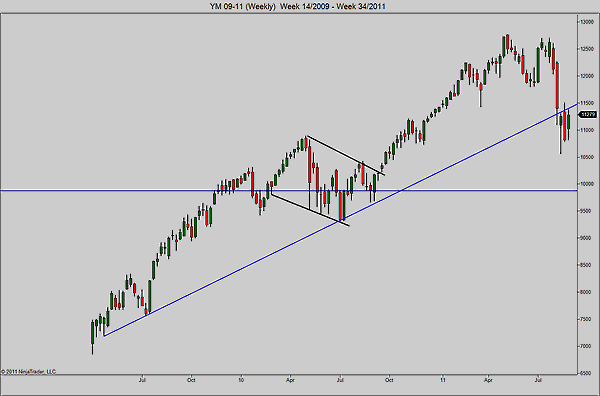
| A similar picture in the Dow futures (YM) weekly chart view (Figure 3): The tradable broke down with gusto, magnetized to a year-long ascending trendline, with the next visible magnet near 9900 level of early 2010 congestion. |

|
| FIGURE 4: YM, DAILY |
| Graphic provided by: eSignal. |
| |
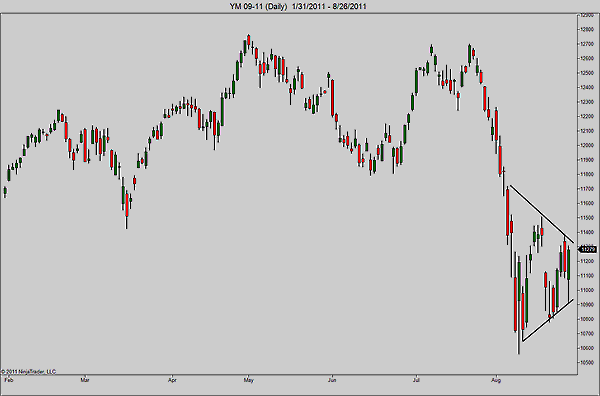
| All wedged up and somewhere to go -- a breakout from this three-week apex pattern will happen soon. It appears probable that the first leg down in early August for S&P and Dow futures has morphed into the first consolidation before second wave continuation (Figure 4). If the next directional push is down, it should be the straighter and greater distance than the initial break from highs has been. |
Austin is a private trader who trades emini stock index futures intraday. He currently trades various futures markets from home in addition to managing a trader's educational forum
| Title: | Individual Trader |
| Company: | CoiledMarkets.com |
| Address: | PO Box 633 |
| Naples, NY 14512 | |
| Website: | coiledmarkets.com/blog |
| E-mail address: | austinp44@yahoo.com |
Traders' Resource Links | |
| CoiledMarkets.com has not added any product or service information to TRADERS' RESOURCE. | |
Click here for more information about our publications!
Comments

Request Information From Our Sponsors
- StockCharts.com, Inc.
- Candle Patterns
- Candlestick Charting Explained
- Intermarket Technical Analysis
- John Murphy on Chart Analysis
- John Murphy's Chart Pattern Recognition
- John Murphy's Market Message
- MurphyExplainsMarketAnalysis-Intermarket Analysis
- MurphyExplainsMarketAnalysis-Visual Analysis
- StockCharts.com
- Technical Analysis of the Financial Markets
- The Visual Investor
- VectorVest, Inc.
- Executive Premier Workshop
- One-Day Options Course
- OptionsPro
- Retirement Income Workshop
- Sure-Fire Trading Systems (VectorVest, Inc.)
- Trading as a Business Workshop
- VectorVest 7 EOD
- VectorVest 7 RealTime/IntraDay
- VectorVest AutoTester
- VectorVest Educational Services
- VectorVest OnLine
- VectorVest Options Analyzer
- VectorVest ProGraphics v6.0
- VectorVest ProTrader 7
- VectorVest RealTime Derby Tool
- VectorVest Simulator
- VectorVest Variator
- VectorVest Watchdog
