HOT TOPICS LIST
- MACD
- Fibonacci
- RSI
- Gann
- ADXR
- Stochastics
- Volume
- Triangles
- Futures
- Cycles
- Volatility
- ZIGZAG
- MESA
- Retracement
- Aroon
INDICATORS LIST
LIST OF TOPICS
PRINT THIS ARTICLE
by Mike Carr, CMT
Stocks like Hansen Natural and Sturm, Ruger & Co. have led the market to the upside and still show strength.
Position: Buy
Mike Carr, CMT
Mike Carr, CMT, is a member of the Market Technicians Association, and editor of the MTA's newsletter, Technically Speaking. He is also the author of "Smarter Investing in Any Economy: The Definitive Guide to Relative Strength Investing," and "Conquering the Divide: How to Use Economic Indicators to Catch Stock Market Trends."
PRINT THIS ARTICLE
RATE OF CHANGE
Market Leaders Making New Highs
08/30/11 08:47:47 AMby Mike Carr, CMT
Stocks like Hansen Natural and Sturm, Ruger & Co. have led the market to the upside and still show strength.
Position: Buy
| The idea of market leaders generally brings to mind the most glamorous bull market winners. Stocks like Google, Apple, and Netflix are widely considered to be leaders. But some of the biggest winners are boring companies far from the high-tech industry. These aren't bellwethers that show a tendency to lead market turning points time and time again. These are just stocks that have led in the most recent market and are likely to continue leading until the bull market is over. |
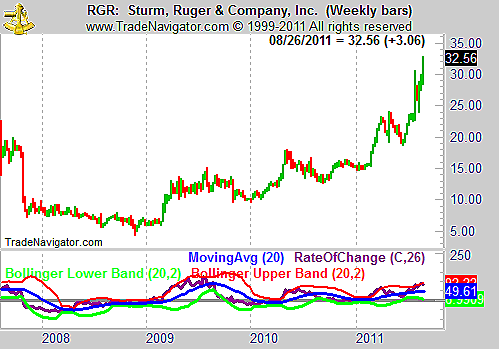
| Sturm, Ruger & Co. (RGR) is one example of an overlooked market leader (Figure 1). The firearms maker bottomed in November 2008 and was actually up about 150% when the broad market finally bottomed in March 2009. Looking at the rate of change (ROC) indicator, momentum was bullish at that time. The stock is up more than 200% since then and is hitting new highs even as the market swooned this summer. |

|
| FIGURE 1: RGR, WEEKLY. The chart shows a company that led the market higher throughout the bull market that began in March 2009. |
| Graphic provided by: Trade Navigator. |
| |
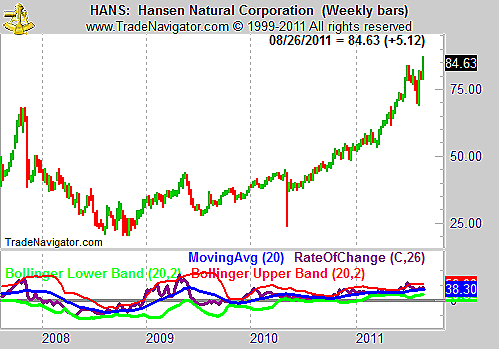
| Hansen Natural (HANS) is another boring company with a strong stock (Figure 2). Since 1996, HANS is up more than 13,000%. The stock doubled between November 2008 and the March 2009 bottom in the major indexes and has doubled again since that time. |

|
| FIGURE 2: HANS, WEEKLY. HANS is another market leader breaking out to new highs. |
| Graphic provided by: Trade Navigator. |
| |
| HANS has an interesting chart, with a very large decline visible in the May 2010 flash crash. The stock fell from $43.08 on the open that day to a low near $24 before closing at $42.54. This chart is an excellent reason why stops should never be placed in the market. That bar was most likely created by investors who had stop-losses entered to protect them, and they were executed at lower and lower prices. As soon as they were all filled, the stock turned sharply higher and closed strong. Stop orders protected investors in HANS from additional profits. |
| These two stocks are still strong, with RGR showing more strength in the ROC indicator. |
Mike Carr, CMT, is a member of the Market Technicians Association, and editor of the MTA's newsletter, Technically Speaking. He is also the author of "Smarter Investing in Any Economy: The Definitive Guide to Relative Strength Investing," and "Conquering the Divide: How to Use Economic Indicators to Catch Stock Market Trends."
| Website: | www.moneynews.com/blogs/MichaelCarr/id-73 |
| E-mail address: | marketstrategist@gmail.com |
Click here for more information about our publications!
PRINT THIS ARTICLE

Request Information From Our Sponsors
- StockCharts.com, Inc.
- Candle Patterns
- Candlestick Charting Explained
- Intermarket Technical Analysis
- John Murphy on Chart Analysis
- John Murphy's Chart Pattern Recognition
- John Murphy's Market Message
- MurphyExplainsMarketAnalysis-Intermarket Analysis
- MurphyExplainsMarketAnalysis-Visual Analysis
- StockCharts.com
- Technical Analysis of the Financial Markets
- The Visual Investor
- VectorVest, Inc.
- Executive Premier Workshop
- One-Day Options Course
- OptionsPro
- Retirement Income Workshop
- Sure-Fire Trading Systems (VectorVest, Inc.)
- Trading as a Business Workshop
- VectorVest 7 EOD
- VectorVest 7 RealTime/IntraDay
- VectorVest AutoTester
- VectorVest Educational Services
- VectorVest OnLine
- VectorVest Options Analyzer
- VectorVest ProGraphics v6.0
- VectorVest ProTrader 7
- VectorVest RealTime Derby Tool
- VectorVest Simulator
- VectorVest Variator
- VectorVest Watchdog
