HOT TOPICS LIST
- MACD
- Fibonacci
- RSI
- Gann
- ADXR
- Stochastics
- Volume
- Triangles
- Futures
- Cycles
- Volatility
- ZIGZAG
- MESA
- Retracement
- Aroon
INDICATORS LIST
LIST OF TOPICS
PRINT THIS ARTICLE
by Koos van der Merwe
How effective is a double top and a double bottom?
Position: Hold
Koos van der Merwe
Has been a technical analyst since 1969, and has worked as a futures and options trader with First Financial Futures in Johannesburg, South Africa.
PRINT THIS ARTICLE
DOUBLE BOTTOMS
Double Bottom, Double Top
08/26/11 09:06:52 AMby Koos van der Merwe
How effective is a double top and a double bottom?
Position: Hold
| A double-bottom formation appears as a W on a chart, and a double top appears as an M. Both formations are very popular, but watch out! Many analysts often mislabel and misinterpret double-top and double-bottom formations. The reason? In any uptrend or downtrend, after a reaction, each new wave appears to be making a double-top or bottom formation. Truth be told, there is no evidence pointing to either a double-top or bottom formation until a confirmation has been made. Nine times out of 10, the active trend will remain in force and prices will simply continue to make new highs or new lows. Confirmation occurs only when the middle high/low in the formation is broken. |

|
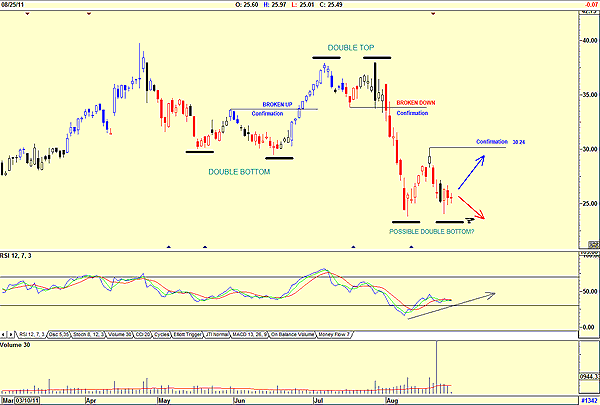
| FIGURE 1: iROBOT, DAILY. iRobot shows a possible double-bottom formation. |
| Graphic provided by: AdvancedGET. |
| |
| Figure 1, a chart of iRobot, shows the two formations quite clearly and suggest that a new double bottom could be forming, but confirmation has not yet been made. My chart shows the double-top and double-bottom formations that developed in iRobot. Note how in both instances the confirmation line was broken as the price moved up/down, confirming the pattern. At the moment, the share price could be forming a new double-bottom pattern, but this will only be confirmed should the price break above the confirmation line at $30.24. Until that happens, the price could move up or down as shown by the red and blue arrows. The relative strength index (RSI), which is moving upward from an oversold position, does suggest that the confirmation line may be broken, but until the price breaks it, nothing can be assumed. Finally, do note that volume as the price fell recently has fallen, suggesting strength. Double-top and double-bottom patterns only become real when the confirmation line has been broken. Until then, it can be watched, but the pattern cannot be verified until the confirmation line is broken. |
Has been a technical analyst since 1969, and has worked as a futures and options trader with First Financial Futures in Johannesburg, South Africa.
| Address: | 3256 West 24th Ave |
| Vancouver, BC | |
| Phone # for sales: | 6042634214 |
| E-mail address: | petroosp@gmail.com |
Click here for more information about our publications!
PRINT THIS ARTICLE

|

Request Information From Our Sponsors
- StockCharts.com, Inc.
- Candle Patterns
- Candlestick Charting Explained
- Intermarket Technical Analysis
- John Murphy on Chart Analysis
- John Murphy's Chart Pattern Recognition
- John Murphy's Market Message
- MurphyExplainsMarketAnalysis-Intermarket Analysis
- MurphyExplainsMarketAnalysis-Visual Analysis
- StockCharts.com
- Technical Analysis of the Financial Markets
- The Visual Investor
- VectorVest, Inc.
- Executive Premier Workshop
- One-Day Options Course
- OptionsPro
- Retirement Income Workshop
- Sure-Fire Trading Systems (VectorVest, Inc.)
- Trading as a Business Workshop
- VectorVest 7 EOD
- VectorVest 7 RealTime/IntraDay
- VectorVest AutoTester
- VectorVest Educational Services
- VectorVest OnLine
- VectorVest Options Analyzer
- VectorVest ProGraphics v6.0
- VectorVest ProTrader 7
- VectorVest RealTime Derby Tool
- VectorVest Simulator
- VectorVest Variator
- VectorVest Watchdog
