HOT TOPICS LIST
- MACD
- Fibonacci
- RSI
- Gann
- ADXR
- Stochastics
- Volume
- Triangles
- Futures
- Cycles
- Volatility
- ZIGZAG
- MESA
- Retracement
- Aroon
INDICATORS LIST
LIST OF TOPICS
PRINT THIS ARTICLE
by Billy Williams
Successful trading is a function of having a system that gives you an edge at each step of the trading process, and the Gang of Four method can give you that winning edge.
Position: Hold
Billy Williams
Billy Williams has been trading the markets for 27 years, specializing in momentum trading with stocks and options.
PRINT THIS ARTICLE
STRATEGIES
The Gang Of Four Method For Trading
08/25/11 09:00:07 AMby Billy Williams
Successful trading is a function of having a system that gives you an edge at each step of the trading process, and the Gang of Four method can give you that winning edge.
Position: Hold
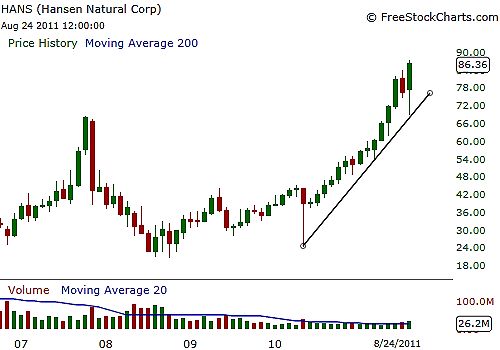
| One of the reasons that companies like McDonald's and Wal-Mart are as successful as they are is that they have created systems for distributing hamburgers and low-cost goods with greater efficiency than their competitors. There may be hamburger joints that make better-tasting hamburgers but few can match the convenience, speed of food delivery, or the low price of a McDonald's franchise. Likewise, most smaller retailers cannot buy their inventory for what Wal-Mart sells the same item for in one of its major supercenters because of the size and scope of both Wal-Mart's purchasing power and distribution network. There is a lesson in this for the aspiring trader: When sizing up a trade, you should aim to have a model, a system for assessing the trend, the directional bias, the entry, and the management of that trade. By doing so, you become more efficient as you scan through a multitude of potential trades and by having a set system or rules in place that dictate your actions, you gain a strong competitive edge over the other traders who overthink and agonize on how to approach a profitable trade. Using a simple four-step system called "the Gang of Four," you can quickly size up a stock's trend. See Figure 1. |

|
| FIGURE 1: HANS, FIVE-YEAR. The five-year chart for HANS reveals a clearly identified bull trend in full effect. Now, all that remains is to chunk down to a smaller time frame to time your entry point. |
| Graphic provided by: www.freestockchart.com. |
| |
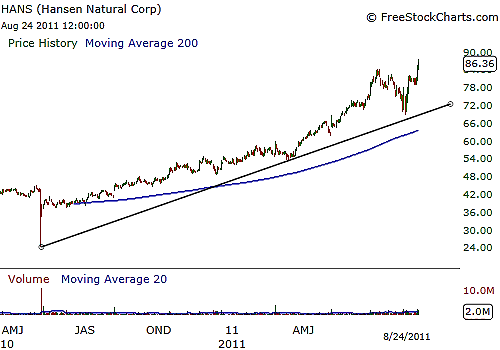
| First, determine directional bias by what the overall market is doing. This is accomplished in a two-part process by, one, checking to see if the Standard & Poor's 500 is trading above its 200-day simple moving average (SMA). "Bulls live above the 200-day SMA and bears live below it" is an old trading maxim that actually has statistical backing according to Larry Connors, hedge fund manager and author of the book "How The Stock Market Really Works," a quantitative study of technical factors, including the 200-day SMA. Connors's study showed that depending on which side price traded on the 200-day SMA, it had a dominant bias in that direction. The second part of the first step of the Gang of Four method is to account for the accumulation and distribution of the general market. This can also be done at a glance by watching for a series of higher highs and higher lows in a bullish market and a series of lower highs and lower lows in a bearish market. See Figure 2. |

|
| FIGURE 2: HANS, DAILY. On the daily chart, the trendline can be seen up close as the stock trades above its 200-day SMA. Note the number of minor pullbacks and new highs that appear. Each of them represent a low-risk entry point. |
| Graphic provided by: www.freestockchart.com. |
| |
| The second step of the Gang of Four method is using the larger time frame to determine the dominant trend in play while using a smaller time frame to time the entries. The first corollary of trading trends is that the larger time frame's trend has more weight than the small time frame. This corollary can be likened to a trader "being too close to the trees to see the forest" when using the smaller time frame without giving credit to the larger time frame's role in trading. The second corollary of trend trading is that smaller time frames allow you to time your entry with greater precision than larger time frames. Again, using a derivation of the metaphor, having a bird's-eye view of the forest does you no good if you need to see what type of trees make up that forest. |
| The third step comes into play once you have determined the directional bias and the time frame that you will use to identify the dominant trend as well as the smaller time frame that you will use to time your entries, at which point you will identify the type of price action in place so that you can determine whether to use a dynamic entry or a static entry. There are two types of price action -- expansion and contraction. Expansion is when price is moving steadily in an easily identified direction while contraction is commonly identified with trading ranges. Identifying the current price action leads to the final step of determining whether to use a dynamic or static entry method. Dynamic entry points are successfully used when a stock or market is in price expansion, which lets price trigger the stop as it continues higher or lower. |
| Static entries use price itself to confirm the reversal of price as it trades between two static price levels -- support and resistance -- by a price bar closing above the intraday high of a previous price bar whose price made contact with support for a long entry. For a short entry, an entry is confirmed when a price bar closes below the intraday low of the previous price bar whose price touches on the resistance level and reacts by trading downward. The Gang of Four method of sizing up a trade is a fast and easy process that allows you to systematize the process of current overall market status, directional bias, trend identification, and entry approach. By using this is as a model for approaching markets and in how to trade them, you will gain a strong edge in maintaining objectivity without overthinking the trade process and put the odds of success on your side as you seamlessly move through each of the steps to profitable trading. |
Billy Williams has been trading the markets for 27 years, specializing in momentum trading with stocks and options.
| Company: | StockOptionSystem.com |
| E-mail address: | stockoptionsystem.com@gmail.com |
Traders' Resource Links | |
| StockOptionSystem.com has not added any product or service information to TRADERS' RESOURCE. | |
Click here for more information about our publications!
Comments
Date: 08/27/11Rank: 4Comment:

|

Request Information From Our Sponsors
- StockCharts.com, Inc.
- Candle Patterns
- Candlestick Charting Explained
- Intermarket Technical Analysis
- John Murphy on Chart Analysis
- John Murphy's Chart Pattern Recognition
- John Murphy's Market Message
- MurphyExplainsMarketAnalysis-Intermarket Analysis
- MurphyExplainsMarketAnalysis-Visual Analysis
- StockCharts.com
- Technical Analysis of the Financial Markets
- The Visual Investor
- VectorVest, Inc.
- Executive Premier Workshop
- One-Day Options Course
- OptionsPro
- Retirement Income Workshop
- Sure-Fire Trading Systems (VectorVest, Inc.)
- Trading as a Business Workshop
- VectorVest 7 EOD
- VectorVest 7 RealTime/IntraDay
- VectorVest AutoTester
- VectorVest Educational Services
- VectorVest OnLine
- VectorVest Options Analyzer
- VectorVest ProGraphics v6.0
- VectorVest ProTrader 7
- VectorVest RealTime Derby Tool
- VectorVest Simulator
- VectorVest Variator
- VectorVest Watchdog
