HOT TOPICS LIST
- MACD
- Fibonacci
- RSI
- Gann
- ADXR
- Stochastics
- Volume
- Triangles
- Futures
- Cycles
- Volatility
- ZIGZAG
- MESA
- Retracement
- Aroon
INDICATORS LIST
LIST OF TOPICS
PRINT THIS ARTICLE
by Alan R. Northam
Statistical analysis is about taking a sample of data, analyzing that data, and making a future forecast from that data.
Position: N/A
Alan R. Northam
Alan Northam lives in the Dallas, Texas area and as an electronic engineer gave him an analytical mind from which he has developed a thorough knowledge of stock market technical analysis. His abilities to analyze the future direction of the stock market has allowed him to successfully trade of his own portfolio over the last 30 years. Mr. Northam is now retired and trading the stock market full time. You can reach him at inquiry@tradersclassroom.com or by visiting his website at http://www.tradersclassroom.com. You can also follow him on Twitter @TradersClassrm.
PRINT THIS ARTICLE
STATISTICS
Whither Gold?
08/25/11 09:07:06 AMby Alan R. Northam
Statistical analysis is about taking a sample of data, analyzing that data, and making a future forecast from that data.
Position: N/A
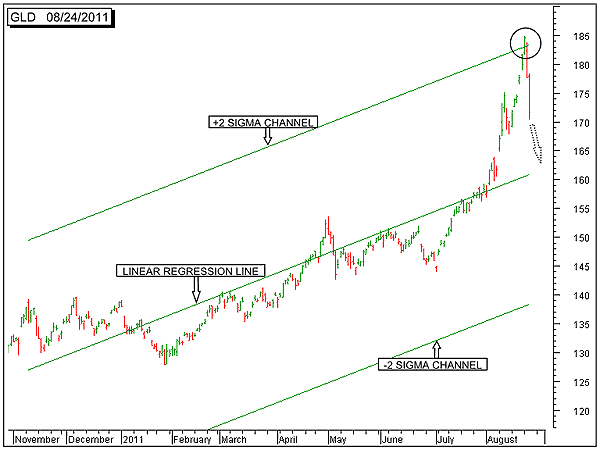
| The lower panel of Figure 1 shows the daily price bars of the SPDR Gold Shares ETF (GLD). This figure shows that I have taken the latest 200-day sample of all existing price data and plotted a 200-day linear regression trendline (middle green line), along with its upper and lower two sigma channel lines. Note that price has recently moved away from the linear regression line and has moved up to the upper two sigma channel line, bounced off, and is headed lower. This is the typical behavior of the upper two sigma channel line in that it acts as a line of resistance. The lower two sigma channel line acts as a line of support. |

|
| FIGURE 1: GLD, DAILY. This chart shows the daily price chart of the SPDR Gold Shares ETF, in the lower panel along with its upward sloping 200-day linear regression trendline and its upper and lower two sigma channel lines. |
| Graphic provided by: AdvancedGET. |
| |
| This is the first time that price has made contact with and bounced off its upper two sigma channel line since December 2009, when GLD corrected over 12%. If GLD again corrects 12% as a result of moving up to its two sigma channel line, that would put GLD at approximately 162, which is right at the linear regression line. |
| It may be a good time to explain what the linear regression line really is. "Regression" refers to the act of "regressing" and "regress" means "To tend to approach a mean." Statistics is all about data (price) moving away from and then regressing (moving back) toward the mean value or the linear regression line. When analyzed over a period of time, it can be seen that price does tend to move away from and then regress back toward the linear regression line, as can be seen in Figure 1. More recently, it now appears that price is in the process of regressing back to its mean value, which is represented by the linear regression trendline. |
| To make a forecast as to what the price of gold will do in the future, we look at the slope of the linear regression line. Price should now move back down to the linear regression line and start to follow it upward, deviating slightly above and below the linear regression trendline, as it continues to move higher going in the future. |
| In conclusion, GLD has now moved the furthest away from the linear regression line it has moved since the end of 2009. We should now expect price to move back to the 200-day linear regression line and then start to follow this line upward. Thus, the long-term trend of gold remains upward until price breaks down below the lower two sigma channel line, at which time a new trend will need to be determined. There is a saying, "A trend in motion, stays in motion, until proven otherwise." |
Alan Northam lives in the Dallas, Texas area and as an electronic engineer gave him an analytical mind from which he has developed a thorough knowledge of stock market technical analysis. His abilities to analyze the future direction of the stock market has allowed him to successfully trade of his own portfolio over the last 30 years. Mr. Northam is now retired and trading the stock market full time. You can reach him at inquiry@tradersclassroom.com or by visiting his website at http://www.tradersclassroom.com. You can also follow him on Twitter @TradersClassrm.
| Garland, Tx | |
| Website: | www.tradersclassroom.com |
| E-mail address: | inquiry@tradersclassroom.com |
Click here for more information about our publications!
PRINT THIS ARTICLE

Request Information From Our Sponsors
- StockCharts.com, Inc.
- Candle Patterns
- Candlestick Charting Explained
- Intermarket Technical Analysis
- John Murphy on Chart Analysis
- John Murphy's Chart Pattern Recognition
- John Murphy's Market Message
- MurphyExplainsMarketAnalysis-Intermarket Analysis
- MurphyExplainsMarketAnalysis-Visual Analysis
- StockCharts.com
- Technical Analysis of the Financial Markets
- The Visual Investor
- VectorVest, Inc.
- Executive Premier Workshop
- One-Day Options Course
- OptionsPro
- Retirement Income Workshop
- Sure-Fire Trading Systems (VectorVest, Inc.)
- Trading as a Business Workshop
- VectorVest 7 EOD
- VectorVest 7 RealTime/IntraDay
- VectorVest AutoTester
- VectorVest Educational Services
- VectorVest OnLine
- VectorVest Options Analyzer
- VectorVest ProGraphics v6.0
- VectorVest ProTrader 7
- VectorVest RealTime Derby Tool
- VectorVest Simulator
- VectorVest Variator
- VectorVest Watchdog
