HOT TOPICS LIST
- MACD
- Fibonacci
- RSI
- Gann
- ADXR
- Stochastics
- Volume
- Triangles
- Futures
- Cycles
- Volatility
- ZIGZAG
- MESA
- Retracement
- Aroon
INDICATORS LIST
LIST OF TOPICS
PRINT THIS ARTICLE
by Andrew Hetherington
Last Thursday when Compuware Corporation (CPWR) tumbled from $11.10 on Wednesday's close to a low of $7.51 on Thursday many were wondering what happened. This 32% loss in one day demonstrates the fragility of today's markets.
Position: N/A
Andrew Hetherington
Classic Dow Theorist who trades as a pure technician, using pattern recognition.
PRINT THIS ARTICLE
BROAD FORMATION
An Early Warning From the Broadening Formation
04/09/02 12:12:40 PMby Andrew Hetherington
Last Thursday when Compuware Corporation (CPWR) tumbled from $11.10 on Wednesday's close to a low of $7.51 on Thursday many were wondering what happened. This 32% loss in one day demonstrates the fragility of today's markets.
Position: N/A
| Looking below in Figure 1 we see a broadening formation that is 4-months long. This pattern is bearish in nature and when the third fan line was broken on Tuesday April 2, 2002 this was an early warning to sell out from your long position. |
| The volume picked up for three days prior to the big drop on the breaking of the third fan line. The suspicious increase in volume on the downside is a significant dumping into weakness. This should capture your attention as a shot across your bow. It's not always the case to see a gradual pickup in activity on the downside. Equities can fall on their own weight but when the dumping is taking place such as in this example, along with the fan line and the pattern, it is a warning of ID (impending doom). |

|
| Figure 1: Daily chart for CPWR. |
| Graphic provided by: SuperCharts. |
| |
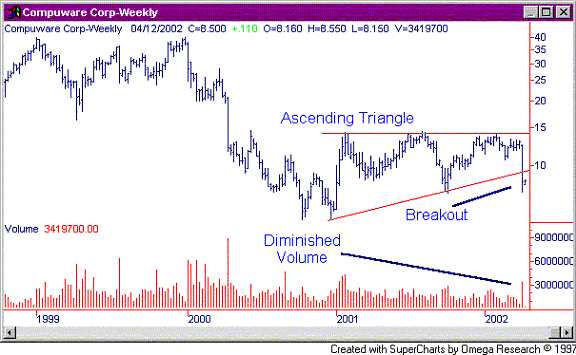
| Some long-term investors might have thought it wasn't all that bad when it broke the third fan line in the $12.00 area. However, looking below in Figure 2 we have the weekly chart. |
 Figure 2: Weekly chart for CPWR. This chart clearly shows a downside breaking of a large 15-month ascending triangle. Although this pattern has a tendency to be bullish, it could not be ignored. The volume on this larger picture is very nice. It clearly diminishes throughout the creation of the pattern. This size of pattern is powerful. These are my preference when trading, since they give a better pop compared to smaller patterns. Unfortunately, you can't always find big patterns. It's a waiting game. |
| The near future will see a typical bear rally up towards the $10.00 breakout line with lighter volume going upwards. If it doesn't show large volume going upwards and it doesn't break through the trendline it will become a very good shorting opportunity. This pullback for an entry point in the $10.00 area should reap some rewards down the road. Forecasting this equity to see $5.00 or lower is quite possible given the size of the pattern. However, whenever the hard drop comes, this is the time to buy back your short. It inevitably rallies upwards after a hard drop. The only caveat in this scenario is to watch the volume and the $10.00 trend line. If this line remains intact and the volume doesn't pick up noticeably, then it will drop. |
Classic Dow Theorist who trades as a pure technician, using pattern recognition.
| Toronto, Canada |
Click here for more information about our publications!
Comments
Date: 04/16/02Rank: 5Comment: An excellent reminder to keep your eye on volume convergence/divergence
Date: 04/16/02Rank: 5Comment: An excellent reminder to keep your eye on volume convergence/divergence AND weekly charts.
Date: 04/21/02Rank: 4Comment:

|

Request Information From Our Sponsors
- StockCharts.com, Inc.
- Candle Patterns
- Candlestick Charting Explained
- Intermarket Technical Analysis
- John Murphy on Chart Analysis
- John Murphy's Chart Pattern Recognition
- John Murphy's Market Message
- MurphyExplainsMarketAnalysis-Intermarket Analysis
- MurphyExplainsMarketAnalysis-Visual Analysis
- StockCharts.com
- Technical Analysis of the Financial Markets
- The Visual Investor
- VectorVest, Inc.
- Executive Premier Workshop
- One-Day Options Course
- OptionsPro
- Retirement Income Workshop
- Sure-Fire Trading Systems (VectorVest, Inc.)
- Trading as a Business Workshop
- VectorVest 7 EOD
- VectorVest 7 RealTime/IntraDay
- VectorVest AutoTester
- VectorVest Educational Services
- VectorVest OnLine
- VectorVest Options Analyzer
- VectorVest ProGraphics v6.0
- VectorVest ProTrader 7
- VectorVest RealTime Derby Tool
- VectorVest Simulator
- VectorVest Variator
- VectorVest Watchdog
