HOT TOPICS LIST
- MACD
- Fibonacci
- RSI
- Gann
- ADXR
- Stochastics
- Volume
- Triangles
- Futures
- Cycles
- Volatility
- ZIGZAG
- MESA
- Retracement
- Aroon
INDICATORS LIST
LIST OF TOPICS
PRINT THIS ARTICLE
by Donald W. Pendergast, Jr.
Sure looks like a double bottom on the daily chart of the Russell 2000 index, doesn't it? Might we get a sustainable rebound in its aftermath?
Position: N/A
Donald W. Pendergast, Jr.
Donald W. Pendergast is a financial markets consultant who offers specialized services to stock brokers and high net worth individuals who seek a better bottom line for their portfolios.
PRINT THIS ARTICLE
DOUBLE BOTTOMS
Double Bottom Or Not?
08/24/11 08:06:33 AMby Donald W. Pendergast, Jr.
Sure looks like a double bottom on the daily chart of the Russell 2000 index, doesn't it? Might we get a sustainable rebound in its aftermath?
Position: N/A
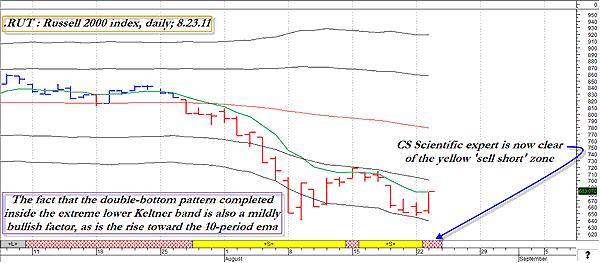
| One of the better-known cable TV networks says that "we know drama." So do millions who watch the daily fluctuations of the US and global stock markets every day -- at least over the past couple of months, anyway. Just between July 7, 2011, and August 9, 2011, for example, the mighty Russell 2000 descended from the 860.00 area all the way down to 639.85! Some sort of a daily double-bottom pattern has now printed, causing a huge sigh of relief to battle-scarred investors, but the big question now is to determine if the huge daily reversal bar of Tuesday, August 23, is the first phase of that desired relief rally or if it's just part of a consolidation range fakeout move before even more substantial downside in the weeks and months ahead. It's impossible to say for sure, but at least we can do our best to make an educated guess. |

|
| FIGURE 1: RUSSELL 2000, DAILY. "Mildly bullish" does not mean the same thing as "red-hot bull market." Never get too aggressive with daily/weekly based swing or position trades until a pattern of higher swing highs and higher swing lows actually prints on the chart of the time frame you are following. Technically, the daily chart for the R2K is depicting a consolidation phase in the midst of an ongoing bear market. |
| Graphic provided by: MetaStock. |
| Graphic provided by: CS Scientific Expert Advisor from MetaStock. |
| |
| One of the more hopeful signs for bullish investors looking to buy fairly close to a major low is the fact that the R2K is quickly closing in on its 10-day exponential moving average (EMA)(red line on chart, Figure 1); a new daily close above it will definitely strengthen the bullish scenario, as will any further market move higher that can cause the August 15, 2011, swing high of 718.63 to be taken out on a daily closing basis. Until that swing high is exceeded, however, this market must still be technically considered to be nothing more than a consolidation phase in the midst of a bear market. Sure, the value players and the bottom-fishers of the world might take a shot on small lots of high-quality stocks (companies with solid earnings and dividends) even before the high at 718.63 is made, but for the most part, the average retail investor should consider standing aside for now, unless they are true dollar-cost average adherents who truly know what they are doing -- and why they are doing it. |
| Traders with proven systems, on the other hand, can probably continue on with their intraday or daily/weekly regimens, confident in the knowledge that they will be likely winners over the long haul if they stick to their systems through thick or thin. They'll still need the wisdom to know when to tweak or even overhaul a particular trading model (if not abandon it altogether). Even long-term investors and buy & holders can benefit from systems designed to help them meet their own unique financial goals. You just need to do a lot of shopping, ask plenty of questions, and fully understand what you want to acomplish before you finally settle on your perfect trading system. In the end, however, you'll probably be glad you took the time to do some serious system shopping. Choose wisely when you do. |
Donald W. Pendergast is a financial markets consultant who offers specialized services to stock brokers and high net worth individuals who seek a better bottom line for their portfolios.
| Title: | Writer, market consultant |
| Company: | Linear Trading Systems LLC |
| Jacksonville, FL 32217 | |
| Phone # for sales: | 904-239-9564 |
| E-mail address: | lineartradingsys@gmail.com |
Traders' Resource Links | |
| Linear Trading Systems LLC has not added any product or service information to TRADERS' RESOURCE. | |
Click here for more information about our publications!
Comments
Date: 08/31/11Rank: 4Comment:

Request Information From Our Sponsors
- StockCharts.com, Inc.
- Candle Patterns
- Candlestick Charting Explained
- Intermarket Technical Analysis
- John Murphy on Chart Analysis
- John Murphy's Chart Pattern Recognition
- John Murphy's Market Message
- MurphyExplainsMarketAnalysis-Intermarket Analysis
- MurphyExplainsMarketAnalysis-Visual Analysis
- StockCharts.com
- Technical Analysis of the Financial Markets
- The Visual Investor
- VectorVest, Inc.
- Executive Premier Workshop
- One-Day Options Course
- OptionsPro
- Retirement Income Workshop
- Sure-Fire Trading Systems (VectorVest, Inc.)
- Trading as a Business Workshop
- VectorVest 7 EOD
- VectorVest 7 RealTime/IntraDay
- VectorVest AutoTester
- VectorVest Educational Services
- VectorVest OnLine
- VectorVest Options Analyzer
- VectorVest ProGraphics v6.0
- VectorVest ProTrader 7
- VectorVest RealTime Derby Tool
- VectorVest Simulator
- VectorVest Variator
- VectorVest Watchdog
