HOT TOPICS LIST
- MACD
- Fibonacci
- RSI
- Gann
- ADXR
- Stochastics
- Volume
- Triangles
- Futures
- Cycles
- Volatility
- ZIGZAG
- MESA
- Retracement
- Aroon
INDICATORS LIST
LIST OF TOPICS
PRINT THIS ARTICLE
by Mike Carr, CMT
Oversold doesn't always mean buy, but the daily chart gives traders some room for optimism.
Position: Buy
Mike Carr, CMT
Mike Carr, CMT, is a member of the Market Technicians Association, and editor of the MTA's newsletter, Technically Speaking. He is also the author of "Smarter Investing in Any Economy: The Definitive Guide to Relative Strength Investing," and "Conquering the Divide: How to Use Economic Indicators to Catch Stock Market Trends."
PRINT THIS ARTICLE
BOLLINGER BANDS
Stocks Are Oversold
08/23/11 08:37:55 AMby Mike Carr, CMT
Oversold doesn't always mean buy, but the daily chart gives traders some room for optimism.
Position: Buy
| Oversold means that prices have fallen too far, too fast. The problem with using traditional technical indicators to determine oversold levels is that the numeric values in many indicators are arbitrary. Formulas constrain many indicators to a range of zero to 100, and oversold is considered to be a level like 20 or 30, and that is arbitrary, to say the least. Bollinger Bands help make definitions of market action more precise. |
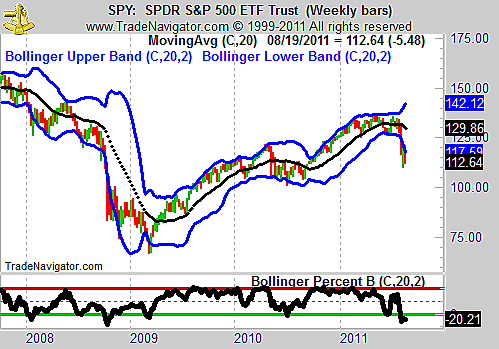
| In addition to the well-known bands, John Bollinger has developed several other indicators including Bollinger Percent B, which defines where price is relative to the bands. A value above 100 shows an overbought market and below zero indicates an oversold market. The bands adapt to market action and give signals relative to volatility. In Figure 1, we can see that the price of the Standard & Poor's 500 on the weekly chart is significantly below the lower Bollinger Band. Percent B is at the lowest level it's seen since the autumn of 2008. The ultimate bottom in that market was still some months away, so oversold at that time was certainly not a signal to buy. |

|
| FIGURE 1: SPY, WEEKLY. The weekly chart of the S&P 500 shows a deeply oversold market. |
| Graphic provided by: Trade Navigator. |
| |
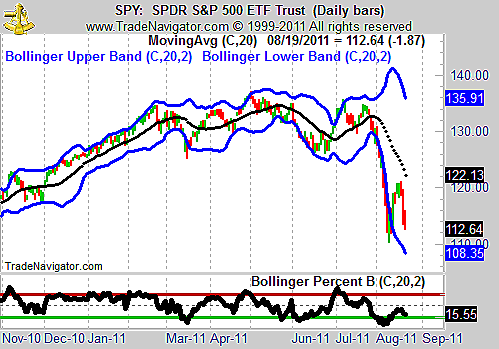
| The daily chart shows a slightly more optimistic picture (Figure 2). In this time frame, we can see that prices could be forming a short-term double bottom, with prices less oversold now than they were only a week earlier. |

|
| FIGURE 2: SPY, DAILY. The daily chart shows a slightly more bullish picture of the S&P 500. |
| Graphic provided by: Trade Navigator. |
| |
| Fast markets are difficult to trade, and in the past several weeks, the S&P 500 has delivered significant intraday volatility. Long-term investors should wait for the Bollinger Bands to contract, a sign that volatility is decreasing. Short-term traders can use Percent B to spot trading signals, buying with a tight stop. |
Mike Carr, CMT, is a member of the Market Technicians Association, and editor of the MTA's newsletter, Technically Speaking. He is also the author of "Smarter Investing in Any Economy: The Definitive Guide to Relative Strength Investing," and "Conquering the Divide: How to Use Economic Indicators to Catch Stock Market Trends."
| Website: | www.moneynews.com/blogs/MichaelCarr/id-73 |
| E-mail address: | marketstrategist@gmail.com |
Click here for more information about our publications!
Comments
Date: 08/31/11Rank: 3Comment:

Request Information From Our Sponsors
- StockCharts.com, Inc.
- Candle Patterns
- Candlestick Charting Explained
- Intermarket Technical Analysis
- John Murphy on Chart Analysis
- John Murphy's Chart Pattern Recognition
- John Murphy's Market Message
- MurphyExplainsMarketAnalysis-Intermarket Analysis
- MurphyExplainsMarketAnalysis-Visual Analysis
- StockCharts.com
- Technical Analysis of the Financial Markets
- The Visual Investor
- VectorVest, Inc.
- Executive Premier Workshop
- One-Day Options Course
- OptionsPro
- Retirement Income Workshop
- Sure-Fire Trading Systems (VectorVest, Inc.)
- Trading as a Business Workshop
- VectorVest 7 EOD
- VectorVest 7 RealTime/IntraDay
- VectorVest AutoTester
- VectorVest Educational Services
- VectorVest OnLine
- VectorVest Options Analyzer
- VectorVest ProGraphics v6.0
- VectorVest ProTrader 7
- VectorVest RealTime Derby Tool
- VectorVest Simulator
- VectorVest Variator
- VectorVest Watchdog
