HOT TOPICS LIST
- MACD
- Fibonacci
- RSI
- Gann
- ADXR
- Stochastics
- Volume
- Triangles
- Futures
- Cycles
- Volatility
- ZIGZAG
- MESA
- Retracement
- Aroon
INDICATORS LIST
LIST OF TOPICS
PRINT THIS ARTICLE
by David Penn
Buy when it is easier to buy, and sell when it is easier to sell.
Position: N/A
David Penn
Technical Writer for Technical Analysis of STOCKS & COMMODITIES magazine, Working-Money.com, and Traders.com Advantage.
PRINT THIS ARTICLE
EASE OF MOVEMENT
Ease of Movement
04/09/02 12:34:03 PMby David Penn
Buy when it is easier to buy, and sell when it is easier to sell.
Position: N/A
| In his book, "Trading Without Fear," author Richard Arms, Jr. says of his Ease of Movement indicator, "...although it is certainly a powerful tool, we will see in future chapters that it is best used as a tool, not as a single discipline." Interestingly, Arms provides this cautionary note because the Ease of Movement indicator is indeed a robust tool for anticipating likely price direction. But also because much of what makes the Ease of Movement indicator work is a bit counterintuitive to most traders and investors who pay attention to and study the relationship between volume and price. One of the most basic tenets of technical analysis (I know, I know, there are many "basic tenets") is that volume should expand on rallies and contract on declines. When prices rally strongly, yet that rally is not accompanied by growing volume, the technical analyst becomes skeptical. Many have noted that volume is the "fuel" for rising prices and without sufficient fuel prices cannot continue to rise for long. At the same time, technical analysts prefer to see volume retreating as prices decline. Indeed, growing volume on falling prices is usually a sign of a market that, while oversold, is also probably in serious trouble. |
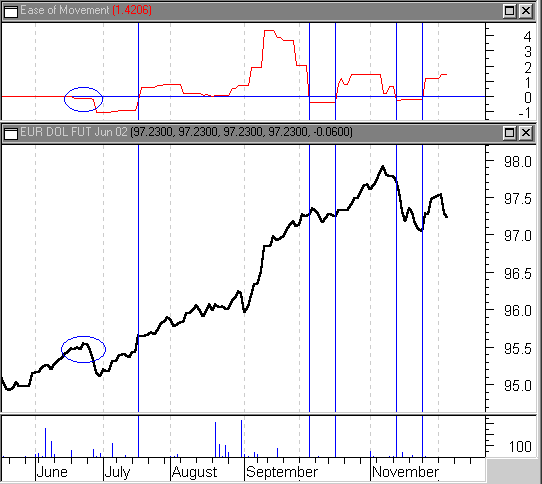
| The Ease of Movement indicator takes a different tack. Arms (who also developed the Equivolume price chart) was always interested in the relationship between volume and price. However, Arms was interested in the question: How much volume is required to move prices up or down? Now generally, when we think of volume and prices moving up, we tend to think of explosive volume spikes that launch prices out of congestion ranges or up off bottoms. While this is often the case, the Ease of Movement indicator treats these cases with relatively little fanfare. Note that the volume spikes in the June Eurodollar contract shown are nowhere near the long vertical lines that indicate buy and sell signals. The Ease of Movement indicator tends to provide higher values when prices are advancing on lighter volume (or, prices need less volume to rise), and lower values when prices are declining on lighter volume (prices need less volume to fall). Buy signals in the Ease of Movement indicator come when the indicator crosses above the zero line. Sell signals come when it crosses below the zero line. While many use a moving average of the Ease of Movement (9-days is popular) to smooth the Ease of Movement indicator, there are times when the signals--the crossing of the zero line--are clear enough that no moving average "signal line" is necessary. In this article, I'll show examples of both situations. |

|
| The Ease of Movement indicator provides clear signals in this strongly trending market. |
| Graphic provided by: MetaStock. |
| |
| The first example looks at the June Eurodollar futures contract. For those unfamiliar with Eurodollars (which have been in a major bull market since bottoming in the spring of 2000), Eurodollars are one of the most widely traded money markets in the world. The Eurodollar market is primarily for dollar-denominated, short-term trading based on interest rates; Campbell R. Harvey's Hypertextual Finance Glossary defines Eurodollars as "a certificate of deposit in U.S. dollars in a bank that is not located in the U.S." Eurodollar futures rallied from their spring 2000 bottom, but only climbed about a point that year. However, in 2001, Eurodollar futures--as shown by the June contract--virtually exploded, advancing 4.5 points by year's end. The Ease of Movement indicator, shown against the June Eurodollar futures contract, provides what appear to be five very good buy/sell signals. The first signal--a buy--comes as the indicator moves upward across the zero line in mid-July 2000. At this point, the June futures are trading at about 95.6. Within thirty days, the June futures are up to almost 96. The value of this move alone is about $1,250 per contract and, by the time a sell signal comes in the Ease of Movement indicator (when the indicator moves back down beneath the zero line in October 2001), the June futures are up to 97.3. The value of the total move from buy signal to sell signal is $4,250 per contract. There is another profitable buy opportunity in mid-October, a profitable sell opportunity in mid-November, and another profitable buy signal only a few weeks later. |
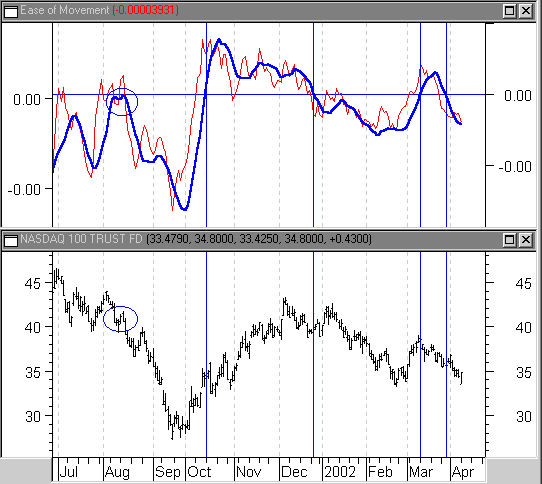
Eurodollars tend to move gradually in fairly well defined trends in which whipsaws occur, but not sharply. This is in contrast to a market like the Nasdaq 100 or QQQ that is prone both to whipsaws and ill-defined trends, as well as false breakouts and other price action known to throw traders and investors off-course. It is here where a moving average of the Ease of Movement indicator is particularly helpful, cutting out the indicator "noise" that was not really present when the indicator was plotted against the June Eurodollar futures contract. A moving average helps cut the noise of the indicator, providing better signals in markets such as the Nasdaq 100. Even a cursory look at the QQQ chart will show some of the perils of trading with the Ease of Movement indicator alone. The whipsaws of July and August 2001 (see circled area) were rough on most traders and those who would have used the Ease of Movement indicator to help navigate that terrain likely fared little better than most. Yet it is for precisely this reason that a moving average plotted over the Ease of Movement indicator can be so beneficial. Once a 9-day moving average of the Ease of Movement indicator is plotted, the whipsaws of the summer of 2001 melt away into a single, potential short play in mid-August. I say "potential" because it is not clear that this trade would have been taken given the fact that the Ease of Movement's moving average never got above the zero line, but instead merely tested it and retreated. It likely would have taken confirmation from some other source--either another indicator or price action itself--before most cautious traders would have felt comfortable going short here. |
| However the post-September 11th long signal that arrives in mid-October 2001 was a very strong signal. Coming in at 34.40, the QQQ was up 14.8% within 30 days. The next signal, a short near the end of December at 39.69 was up marginally 30 days later in January (up 2%), though the QQQ continued downward, finally bottoming at 33.65 in late February (15% in 60 days). The long QQQ signal in March 2002 was a bust--though a small one. The most recent signal, a short on March 22nd, remains profitable as of this writing. |
Technical Writer for Technical Analysis of STOCKS & COMMODITIES magazine, Working-Money.com, and Traders.com Advantage.
| Title: | Technical Writer |
| Company: | Technical Analysis, Inc. |
| Address: | 4757 California Avenue SW |
| Seattle, WA 98116 | |
| Phone # for sales: | 206 938 0570 |
| Fax: | 206 938 1307 |
| Website: | www.Traders.com |
| E-mail address: | DPenn@traders.com |
Traders' Resource Links | |
| Charting the Stock Market: The Wyckoff Method -- Books | |
| Working-Money.com -- Online Trading Services | |
| Traders.com Advantage -- Online Trading Services | |
| Technical Analysis of Stocks & Commodities -- Publications and Newsletters | |
| Working Money, at Working-Money.com -- Publications and Newsletters | |
| Traders.com Advantage -- Publications and Newsletters | |
| Professional Traders Starter Kit -- Software | |
Click here for more information about our publications!
Comments
Date: 04/13/02Rank: 5Comment:
Date: 04/16/02Rank: 1Comment: Interesting...but the article doesn t say WHERE I can access this Ease of Movement indicator. I would love to use it if I could find it.
Date: 04/21/02Rank: 4Comment:
Date: 04/25/02Rank: 5Comment: where to find such indicators? could you provice some website which provice this indicators? Pls let me know by email: jjtang200@yahoo.com. thanks.

|

Request Information From Our Sponsors
- StockCharts.com, Inc.
- Candle Patterns
- Candlestick Charting Explained
- Intermarket Technical Analysis
- John Murphy on Chart Analysis
- John Murphy's Chart Pattern Recognition
- John Murphy's Market Message
- MurphyExplainsMarketAnalysis-Intermarket Analysis
- MurphyExplainsMarketAnalysis-Visual Analysis
- StockCharts.com
- Technical Analysis of the Financial Markets
- The Visual Investor
- VectorVest, Inc.
- Executive Premier Workshop
- One-Day Options Course
- OptionsPro
- Retirement Income Workshop
- Sure-Fire Trading Systems (VectorVest, Inc.)
- Trading as a Business Workshop
- VectorVest 7 EOD
- VectorVest 7 RealTime/IntraDay
- VectorVest AutoTester
- VectorVest Educational Services
- VectorVest OnLine
- VectorVest Options Analyzer
- VectorVest ProGraphics v6.0
- VectorVest ProTrader 7
- VectorVest RealTime Derby Tool
- VectorVest Simulator
- VectorVest Variator
- VectorVest Watchdog
