HOT TOPICS LIST
- MACD
- Fibonacci
- RSI
- Gann
- ADXR
- Stochastics
- Volume
- Triangles
- Futures
- Cycles
- Volatility
- ZIGZAG
- MESA
- Retracement
- Aroon
INDICATORS LIST
LIST OF TOPICS
PRINT THIS ARTICLE
by Koos van der Merwe
Gold has been making new highs as the market has been falling.
Position: Sell
Koos van der Merwe
Has been a technical analyst since 1969, and has worked as a futures and options trader with First Financial Futures in Johannesburg, South Africa.
PRINT THIS ARTICLE
GANN
Looking At Gold Through The Eyes Of Gann
08/22/11 10:27:16 AMby Koos van der Merwe
Gold has been making new highs as the market has been falling.
Position: Sell
| If it is not the US debt crisis, with politics taking precedence over the economy, then it is the weakening economy of Europe that is affecting the stock market. The US indexes have been falling daily, and investors have been running to the two safe havens they know, gold under the mattress. To find out how much higher gold can rise, I decided to take a look at streetTracks Gold (GLD), but through the eyes of W.D. Gann. |

|
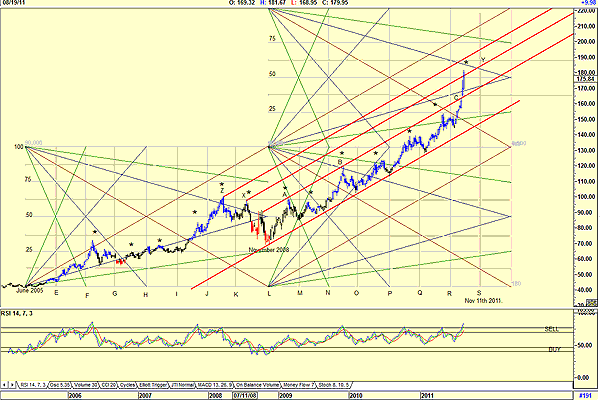
| FIGURE 1: GOLD WITH GANN SQUARES, WEEKLY |
| Graphic provided by: AdvancedGET. |
| |
| Figure 1 is a weekly chart of streetTracks gold. I have superimposed three Gann squares over the chart. Do note the following: 1. I have drawn a 90-degree Gann square. The 90-degree angle line is in red. I have copied the angle and shown how it has acted as the support line for the rise of GLD since November 2008. 2. Using the same 90-degree angle, I have drawn resistance lines, which have been tested at A and B, rising above the resistance line on a gap at C. 3. GLD broke above the resistance line X, Y, suggesting that it could move to test the resistance line, Z. 4. Note how at approximately every square quarter, 25, 50, and 75, and 100, GLD paused, moving into a sideways trend or falling as though collecting itself before moving higher. 5. Note how the Gann square identified the low of November 2008 before moving higher in a strong move. 6. Note the vertical lines E to S, which offered suggestions of a trend reversal. The line at S is suggesting that GLD should reverse on November 11, but this need not be a top, but more a bottom. A look at the chart shows that highs occurred at the 50% level between the horizontal lines. This suggests that GLD could be topping at the moment and should form a low at November 11. 7. Note the relative strength index (RSI) correctly gave buy and sell signals, although the indicator did not drop into the buy zone at O, P, or Q. Nevertheless, a buy suggestion was made as the indicator rose above its moving average, as shown in red. At the moment, the RSI is in the overbought area. |

|
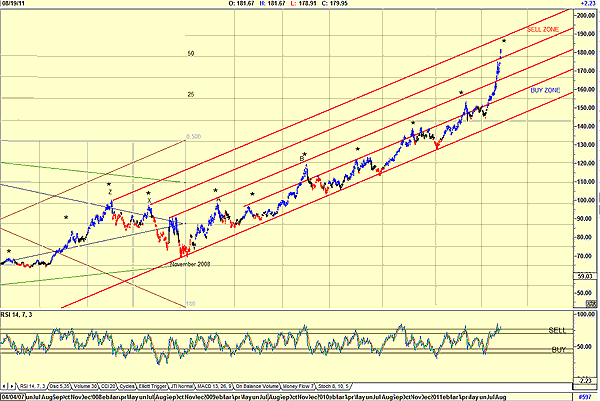
| FIGURE 2: GOLD SUGGESTING A SELL SIGNAL, DAILY |
| Graphic provided by: AdvancedGET. |
| |
| Figure 2, the daily chart, suggests that a high has been reached and that we could expect a correction soon. This is confirmed by the RSI, which has given a sell signal. GLD is also in a Gann sell zone. I would not be a buyer of any gold at present. The fact that GLD does look overbought and suggesting a sell signal could mean that the market could start recovering. Let us hope so. |
Has been a technical analyst since 1969, and has worked as a futures and options trader with First Financial Futures in Johannesburg, South Africa.
| Address: | 3256 West 24th Ave |
| Vancouver, BC | |
| Phone # for sales: | 6042634214 |
| E-mail address: | petroosp@gmail.com |
Click here for more information about our publications!
Comments

|

Request Information From Our Sponsors
- StockCharts.com, Inc.
- Candle Patterns
- Candlestick Charting Explained
- Intermarket Technical Analysis
- John Murphy on Chart Analysis
- John Murphy's Chart Pattern Recognition
- John Murphy's Market Message
- MurphyExplainsMarketAnalysis-Intermarket Analysis
- MurphyExplainsMarketAnalysis-Visual Analysis
- StockCharts.com
- Technical Analysis of the Financial Markets
- The Visual Investor
- VectorVest, Inc.
- Executive Premier Workshop
- One-Day Options Course
- OptionsPro
- Retirement Income Workshop
- Sure-Fire Trading Systems (VectorVest, Inc.)
- Trading as a Business Workshop
- VectorVest 7 EOD
- VectorVest 7 RealTime/IntraDay
- VectorVest AutoTester
- VectorVest Educational Services
- VectorVest OnLine
- VectorVest Options Analyzer
- VectorVest ProGraphics v6.0
- VectorVest ProTrader 7
- VectorVest RealTime Derby Tool
- VectorVest Simulator
- VectorVest Variator
- VectorVest Watchdog
