HOT TOPICS LIST
- MACD
- Fibonacci
- RSI
- Gann
- ADXR
- Stochastics
- Volume
- Triangles
- Futures
- Cycles
- Volatility
- ZIGZAG
- MESA
- Retracement
- Aroon
INDICATORS LIST
LIST OF TOPICS
PRINT THIS ARTICLE
by Matt Blackman
On August 2, I warned that head & shoulders top patterns were popping up on a number of major indexes and ETFs. So what does that mean?
Position: N/A
Matt Blackman
Matt Blackman is a full-time technical and financial writer and trader. He produces corporate and financial newsletters, and assists clients in getting published in the mainstream media. He is the host of TradeSystemGuru.com. Matt has earned the Chartered Market Technician (CMT) designation. Find out what stocks and futures Matt is watching on Twitter at www.twitter.com/RatioTrade
PRINT THIS ARTICLE
HEAD & SHOULDERS
Head & Shoulder Warnings Should Not Be Ignored
08/19/11 12:03:02 PMby Matt Blackman
On August 2, I warned that head & shoulders top patterns were popping up on a number of major indexes and ETFs. So what does that mean?
Position: N/A
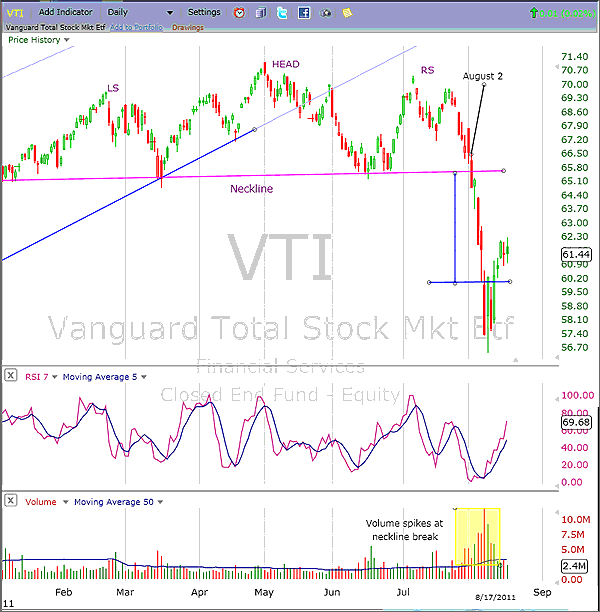
| One benefit of social media is that it allows traders to have their calls, both good and bad, saved for posterity. On August 2, I warned (http://www.twitter.com/MattBlackmanCMT) that the VTI (Vanguard Total Index ETF) and some other major indexes had just fired bearish head & shoulders top patterns on high-selling volume. At the time I was astonished that the pattern was so widespread. I had noted the week earlier (July 27) that the Dow Jones Transportation Average (DJTA) was showing troubling negative divergence versus the Dow Jones Industrial Average (DJIA), another bearish omen, since transports often lead the industries both in rallies and corrections. Sotheby's, another good market proxy, confirmed the head & shoulders pattern on August 8. |

|
| FIGURE 1: VANGUARD TOTAL MARKET ETF, DAILY. Here's a basket of more than 3,000 US large-cap stocks showing the head & shoulders top pattern with minimum target and action since the neckline was broken on August 2. Note volume during the breakdown and recovery. |
| Graphic provided by: FreeStockCharts.com. |
| |
| However, I had no idea how quickly, severely, and widespread the fallout would be. Often, price will attempt a pullback toward the neckline in a confirmation move, which can be a good time to get short. But there was only one up day after the neckline was breached, so it was a very brief second short window, indeed. |
| According to Thomas Bulkowski in his essential reference, "Encyclopedia Of Chart Patterns" (2nd ed.), head & shoulders tops are rated no. 1 out of 21 bear patterns he rated in bull markets. Trend reversals occurred 51% of the time, while 55% of the time the minimum price target was met as expected and pullbacks toward the neckline occurred 50% of the time. No explanation was provided if the market was in a secular or cyclical bull market, so I will assume he was referring to shorter-term (cyclical) variety markets, since US stocks have been in a secular bear market since 2000. |
| So what's next for traders? If markets rally strongly from here, the plethora of head & shoulders patterns could be invalidated, and as trading icon Dan Zanger says, a pattern failure signal is as strong as or stronger than a pattern success. In the case of VTI (Figure 1), the minimum target was met, so the pattern was successful, but a break above the neckline on convincing buying volume could still provide a powerful buy signal. |
Matt Blackman is a full-time technical and financial writer and trader. He produces corporate and financial newsletters, and assists clients in getting published in the mainstream media. He is the host of TradeSystemGuru.com. Matt has earned the Chartered Market Technician (CMT) designation. Find out what stocks and futures Matt is watching on Twitter at www.twitter.com/RatioTrade
| Company: | TradeSystemGuru.com |
| Address: | Box 2589 |
| Garibaldi Highlands, BC Canada | |
| Phone # for sales: | 604-898-9069 |
| Fax: | 604-898-9069 |
| Website: | www.tradesystemguru.com |
| E-mail address: | indextradermb@gmail.com |
Traders' Resource Links | |
| TradeSystemGuru.com has not added any product or service information to TRADERS' RESOURCE. | |
Click here for more information about our publications!
PRINT THIS ARTICLE

Request Information From Our Sponsors
- StockCharts.com, Inc.
- Candle Patterns
- Candlestick Charting Explained
- Intermarket Technical Analysis
- John Murphy on Chart Analysis
- John Murphy's Chart Pattern Recognition
- John Murphy's Market Message
- MurphyExplainsMarketAnalysis-Intermarket Analysis
- MurphyExplainsMarketAnalysis-Visual Analysis
- StockCharts.com
- Technical Analysis of the Financial Markets
- The Visual Investor
- VectorVest, Inc.
- Executive Premier Workshop
- One-Day Options Course
- OptionsPro
- Retirement Income Workshop
- Sure-Fire Trading Systems (VectorVest, Inc.)
- Trading as a Business Workshop
- VectorVest 7 EOD
- VectorVest 7 RealTime/IntraDay
- VectorVest AutoTester
- VectorVest Educational Services
- VectorVest OnLine
- VectorVest Options Analyzer
- VectorVest ProGraphics v6.0
- VectorVest ProTrader 7
- VectorVest RealTime Derby Tool
- VectorVest Simulator
- VectorVest Variator
- VectorVest Watchdog
