HOT TOPICS LIST
- MACD
- Fibonacci
- RSI
- Gann
- ADXR
- Stochastics
- Volume
- Triangles
- Futures
- Cycles
- Volatility
- ZIGZAG
- MESA
- Retracement
- Aroon
INDICATORS LIST
LIST OF TOPICS
PRINT THIS ARTICLE
by Andrew Hetherington
When is the best time to buy on a head and shoulders bottom reversal?
Position: N/A
Andrew Hetherington
Classic Dow Theorist who trades as a pure technician, using pattern recognition.
PRINT THIS ARTICLE
STRATEGIES
Trading Tactics - When to Buy?
04/05/02 02:04:47 PMby Andrew Hetherington
When is the best time to buy on a head and shoulders bottom reversal?
Position: N/A
| One of the more crucial techniques to master trading using technical analysis is determining the right time to buy a long position. |
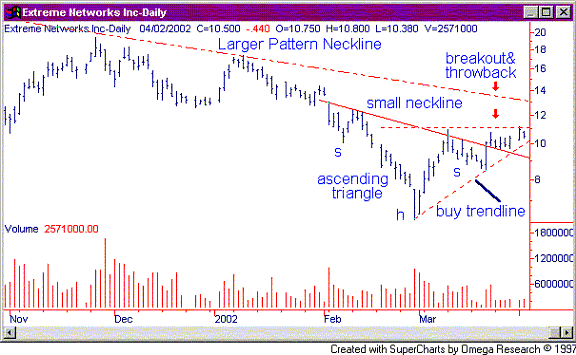
| The example shown in Figure 1 for Extreme Networks Incorporated (EXTR) illustrates a technique with limited downside. |

|
| Figure 1: Daily chart for EXTR. |
| Graphic provided by: SuperCharts. |
| |
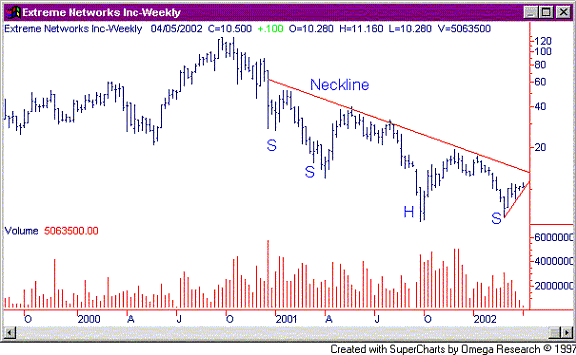
| Here we have a daily chart with multiple bullish patterns within patterns. As is usually the case there are many signals within this chart and the tricky part is knowing which signal to use to buy a long position. First of all, your time horizon is important. Lets suggest this as a short to medium term time horizon (1 day - 10 months). We have a small 1-month ascending triangle with nice volume on the creation of the pattern. This pattern has a breakout in the $11.00 area if all goes well. Secondly, we have a small 2-month head and shoulders pattern that has already given the confirmation with a topside breakout and a throwback to our buy in point in the $10.00 area. All this is within a much larger 16-month head and shoulders bottom reversal. In Figure 2 you can see we are currently near the bottom of the first right shoulder. |
 Figure 2: Weekly chart for EXTR. This larger head and shoulders pattern is not completed yet and we are anticipating a topside breakout. Caution is necessary when trading within the pattern since it could still go down a little to form a second right shoulder. I mention this since there is a tendency for symmetry within these patterns and the left side has two shoulders. |
| My suggestion is to use the small trend line from the base of the head to the base of the right shoulder on the small head and shoulders pattern as your buy in line. This line is in the $10.20 - $10.40 area currently. If this line is broken on the downside to form another shoulder then you sell and take a limited small loss. A stop loss just below this line is appropriate for those who can't watch it close. This line slopes upwards and therefore the stop loss must be moved upwards accordingly. The last thing we are looking for is for the volume to begin to increase from this point forward. If the volume does not pick up significantly, then it will likely break on the downside. If all goes well and we have anticipated correctly we will see a topside breakout from the small triangle in the $11.00 area. After which we are hopeful for another breakout from the much larger pattern in the $13.00 area. Then we will use my performance line to decide when to sell and lock in our profits. |
Classic Dow Theorist who trades as a pure technician, using pattern recognition.
| Toronto, Canada |
Click here for more information about our publications!
Comments
Date: 04/10/02Rank: 5Comment: Very good and clear analysis, although I admit that he seems to be stretching the idea of H S a bit. I find the left shoulders a bit shallow...I wouldn t have recognized them as part of a H S pattern.
Date: 04/13/02Rank: 1Comment: What the he-- is this chart telling me????
Date: 04/16/02Rank: 1Comment: I put this chart up on Stockcharts.com, monthly. The Chaiken Money Flow indicator is flashing a warning signal that there is great selling going on here. I like to see declining price action with CMF improving, as happened with the gold shares during the past nine months. Also, there are no three Elliott Waves down. I also take issue with your concept of head and shoulders pattern. Your constant use of this pattern on a slope conflicts with my understanding that the pattern should be level. You could be trying to invent patterns where they aren t.
Date: 04/24/02Rank: 5Comment:

Request Information From Our Sponsors
- StockCharts.com, Inc.
- Candle Patterns
- Candlestick Charting Explained
- Intermarket Technical Analysis
- John Murphy on Chart Analysis
- John Murphy's Chart Pattern Recognition
- John Murphy's Market Message
- MurphyExplainsMarketAnalysis-Intermarket Analysis
- MurphyExplainsMarketAnalysis-Visual Analysis
- StockCharts.com
- Technical Analysis of the Financial Markets
- The Visual Investor
- VectorVest, Inc.
- Executive Premier Workshop
- One-Day Options Course
- OptionsPro
- Retirement Income Workshop
- Sure-Fire Trading Systems (VectorVest, Inc.)
- Trading as a Business Workshop
- VectorVest 7 EOD
- VectorVest 7 RealTime/IntraDay
- VectorVest AutoTester
- VectorVest Educational Services
- VectorVest OnLine
- VectorVest Options Analyzer
- VectorVest ProGraphics v6.0
- VectorVest ProTrader 7
- VectorVest RealTime Derby Tool
- VectorVest Simulator
- VectorVest Variator
- VectorVest Watchdog
