

HOT TOPICS LIST
- MACD
- Fibonacci
- RSI
- Gann
- ADXR
- Stochastics
- Volume
- Triangles
- Futures
- Cycles
- Volatility
- ZIGZAG
- MESA
- Retracement
- Aroon
INDICATORS LIST
LIST OF TOPICS
PRINT THIS ARTICLE
by Mike Carr, CMT
The recent decline in stock prices was deep, leading to the inevitable question of whether or not we're in a bear market. The answer depends upon the index and the time frame.
Position: Hold
Mike Carr, CMT
Mike Carr, CMT, is a member of the Market Technicians Association, and editor of the MTA's newsletter, Technically Speaking. He is also the author of "Smarter Investing in Any Economy: The Definitive Guide to Relative Strength Investing," and "Conquering the Divide: How to Use Economic Indicators to Catch Stock Market Trends."
PRINT THIS ARTICLE
CHART ANALYSIS
Is This a Bear Market?
08/16/11 07:13:55 AMby Mike Carr, CMT
The recent decline in stock prices was deep, leading to the inevitable question of whether or not we're in a bear market. The answer depends upon the index and the time frame.
Position: Hold
| Bear markets are usually thought of as price declines of 20% from a peak. By that definition, the August swoon doesn't qualify in the major stock market indexes. The Dow Jones Industrial Average fell nearly 18%, the S&P 500 more than 19% which is very close to a bear market. That closeness alone highlights the difficulty of defining bears. What is so magical about 20%? |
| Ned Davis Research, a very well respected research firm, defines a bear market as a 30% drop in the Dow Jones Industrial Average over the course of 50 days or a 13% decline in the average after 145 days. By that definition, the recent declines do qualify as bear markets. |
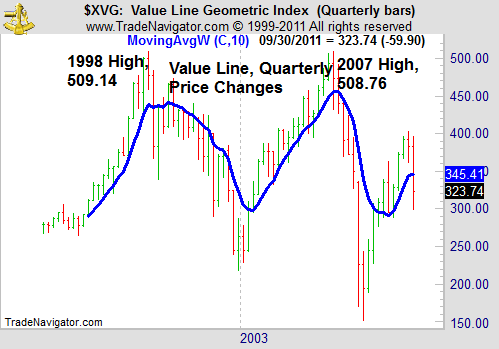
| Looking at a less widely followed index, the Value Line Geometric Index, stocks have fallen more than 25% since their May highs. From a longer term perspective, the Value Line Index shows that stocks have been in a bear market since 1998 (Figure 1). This is a quarterly chart so it wouldn't be used for trading but is useful to show the price action over the past 13 years. |
|
| Figure 1: The Value Line Geometric Index is more than 35% below its 1998 highs. |
| Graphic provided by: Trade Navigator. |
| |
| Value Line uses a geometric average to maintain this index and some analysts view it as a representation of the price action of the typical stock. To calculate the index, Value Line explains that, "the daily change of the geometric index is found by multiplying the ratio of each stock's closing price to its previous close and raising that result to the reciprocal of the number of stocks tracked." There are more than 1600 stocks in the index. |
| Stocks have been in extended trading ranges before. After the 1929 crash, stocks needed 25 years to reach their old highs. A 16 year trading range preceded the great bull market that began in 1982. While this latest decline may not be a bear market in everyone's mind, stocks have been in a long-term bear market for more than a decade. |
Mike Carr, CMT, is a member of the Market Technicians Association, and editor of the MTA's newsletter, Technically Speaking. He is also the author of "Smarter Investing in Any Economy: The Definitive Guide to Relative Strength Investing," and "Conquering the Divide: How to Use Economic Indicators to Catch Stock Market Trends."
| Website: | www.moneynews.com/blogs/MichaelCarr/id-73 |
| E-mail address: | marketstrategist@gmail.com |
Click here for more information about our publications!
PRINT THIS ARTICLE

Request Information From Our Sponsors
- StockCharts.com, Inc.
- Candle Patterns
- Candlestick Charting Explained
- Intermarket Technical Analysis
- John Murphy on Chart Analysis
- John Murphy's Chart Pattern Recognition
- John Murphy's Market Message
- MurphyExplainsMarketAnalysis-Intermarket Analysis
- MurphyExplainsMarketAnalysis-Visual Analysis
- StockCharts.com
- Technical Analysis of the Financial Markets
- The Visual Investor
- VectorVest, Inc.
- Executive Premier Workshop
- One-Day Options Course
- OptionsPro
- Retirement Income Workshop
- Sure-Fire Trading Systems (VectorVest, Inc.)
- Trading as a Business Workshop
- VectorVest 7 EOD
- VectorVest 7 RealTime/IntraDay
- VectorVest AutoTester
- VectorVest Educational Services
- VectorVest OnLine
- VectorVest Options Analyzer
- VectorVest ProGraphics v6.0
- VectorVest ProTrader 7
- VectorVest RealTime Derby Tool
- VectorVest Simulator
- VectorVest Variator
- VectorVest Watchdog