HOT TOPICS LIST
- MACD
- Fibonacci
- RSI
- Gann
- ADXR
- Stochastics
- Volume
- Triangles
- Futures
- Cycles
- Volatility
- ZIGZAG
- MESA
- Retracement
- Aroon
INDICATORS LIST
LIST OF TOPICS
PRINT THIS ARTICLE
by Koos van der Merwe
The volatility of the past week stressed the first rule of Elliott wave theory -- namely, the chart must look correct.
Position: Buy
Koos van der Merwe
Has been a technical analyst since 1969, and has worked as a futures and options trader with First Financial Futures in Johannesburg, South Africa.
PRINT THIS ARTICLE
ELLIOTT WAVE
Alternate Dow Count?
08/17/11 09:49:41 AMby Koos van der Merwe
The volatility of the past week stressed the first rule of Elliott wave theory -- namely, the chart must look correct.
Position: Buy
| One of the first rules I learned from Robert Prechter when I became an Elliott wave enthusiast in the 1980s was that the Elliott wave count must look correct. Looking for a complicated count only leads to confusion. If you cannot "see" a count, then stand aside until one appears. I learned this the hard way over the years, often refusing to change my opinion when a far simpler wave count showed itself. That is a disaster most analysts do not avoid. They adopt an opinion, and then stick to it through hell and high water. Even economist Nouriel "Dr. Doom" Roubini changes his opinion. In my latest reading, I understand that he is now only 50% bearish. |

|
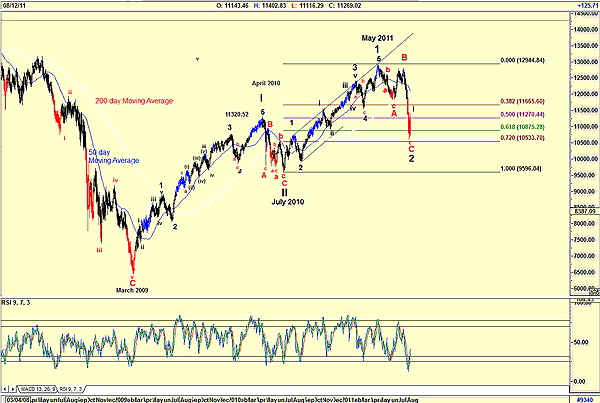
| FIGURE 1: LATEST WAVE COUNT OF THE DJIA |
| Graphic provided by: AdvancedGET. |
| |
| Figure 1 shows my latest Elliott wave count of the Dow Jones Industrial Average (DJIA). I believe the market has completed a wave 2 of wave III because with the market meltdown of the past week, the correction was a 72% retracement of the up move from July 2010 to May 2011. This percentage retracement, I have found over the years, is more associated with a wave 2 retracement than a wave 4 retracement. So in following the first rule of Elliott wave theory, I must accept that it could indeed be a wave 2 of wave III until proven otherwise. Never forget, Elliott wave theory is simply a signpost in the wilderness, and that signpost leads to another one a little way down the road. For now, and with the relative strength index (RSI) giving a buy signal, I must accept that the DJIA could indeed be in a wave i of wave 3 of wave III. How high the wave i can go could be a Fibonacci count of the fall of wave 2 of wave II, with 11768 being a 50% retracement (not shown). With September, usually the quietest month of the year around the corner, and October known for its dramatic market corrections, we could see wave ii of wave 3 of wave III happening, but that is anyone's guess. Yes, the next few months should be interesting. Never forget that the best months in any year are November to May, which could be wave iii of wave 3 of wave III. Have a good one. |
Has been a technical analyst since 1969, and has worked as a futures and options trader with First Financial Futures in Johannesburg, South Africa.
| Address: | 3256 West 24th Ave |
| Vancouver, BC | |
| Phone # for sales: | 6042634214 |
| E-mail address: | petroosp@gmail.com |
Click here for more information about our publications!
Comments

Request Information From Our Sponsors
- StockCharts.com, Inc.
- Candle Patterns
- Candlestick Charting Explained
- Intermarket Technical Analysis
- John Murphy on Chart Analysis
- John Murphy's Chart Pattern Recognition
- John Murphy's Market Message
- MurphyExplainsMarketAnalysis-Intermarket Analysis
- MurphyExplainsMarketAnalysis-Visual Analysis
- StockCharts.com
- Technical Analysis of the Financial Markets
- The Visual Investor
- VectorVest, Inc.
- Executive Premier Workshop
- One-Day Options Course
- OptionsPro
- Retirement Income Workshop
- Sure-Fire Trading Systems (VectorVest, Inc.)
- Trading as a Business Workshop
- VectorVest 7 EOD
- VectorVest 7 RealTime/IntraDay
- VectorVest AutoTester
- VectorVest Educational Services
- VectorVest OnLine
- VectorVest Options Analyzer
- VectorVest ProGraphics v6.0
- VectorVest ProTrader 7
- VectorVest RealTime Derby Tool
- VectorVest Simulator
- VectorVest Variator
- VectorVest Watchdog
