HOT TOPICS LIST
- MACD
- Fibonacci
- RSI
- Gann
- ADXR
- Stochastics
- Volume
- Triangles
- Futures
- Cycles
- Volatility
- ZIGZAG
- MESA
- Retracement
- Aroon
INDICATORS LIST
LIST OF TOPICS
PRINT THIS ARTICLE
by Chaitali Mohile
The technical charts of Diamond Foods gives two different views. Will the bullish trend reversal succeed?
Position: N/A
Chaitali Mohile
Active trader in the Indian stock markets since 2003 and a full-time writer. Trading is largely based upon technical analysis.
PRINT THIS ARTICLE
CHART ANALYSIS
DMND Undergoing Trend Reversal Rally?
08/12/11 02:28:17 PMby Chaitali Mohile
The technical charts of Diamond Foods gives two different views. Will the bullish trend reversal succeed?
Position: N/A
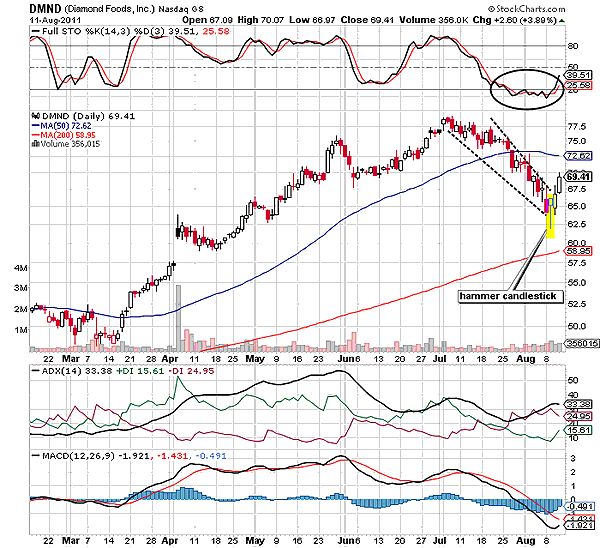
| An intermediate descending rally of Diamond Foods (DMND) formed a falling wedge on its daily time frame chart in Figure 1. The falling wedge is a bullish reversal pattern that breaks upward, initiating a fresh bullish rally. A hammer candlestick is formed at the narrowing end of the wedge in Figure 1. The yellow block in the price chart highlights the hammer -- the bullish reversal candlestick pattern of DMND. This is a single candlestick formation, which ends the existing downtrend and begins a fresh bullish trend. The average directional index (ADX) (14) has been descending from a highly overheated uptrend level, forming lower highs in the developed region. The declining ADX (14) reached the well-developed area during the formation of the falling wedge. The downtrend emerged by the time falling wedge was completely formed. The hammer candlestick confirmed the falling wedge as bullish reversal formation. |

|
| FIGURE 1: DMND, DAILY |
| Graphic provided by: StockCharts.com. |
| |
| The developing downtrend of DMND is about to change. We can see in Figure 1 that the price has already surged to $69.41 from the breakout points. The selling pressure indicated by the negative directional index (-DI) is declining, and the positive directional index (+DI) is ascending. Therefore, -DI and +DI are ready to converge. The ADX line already exists in the developing area, but the buying pressure has to suppress the -DI. The increasing buying pressure encouraged the stock to break upward. The full stochastic (14,3,3) is oversold, indicating a fresh bullish rally, and also offers new buying opportunities. The negative moving average convergence/divergence (MACD) (12,26,9) is ready to undergo a bullish crossover. Thus, the conditions in Figure 1 are perfect to carry the bullish breakout rally higher. But the immediate resistance of the 50-day MA is likely to unnerve the rally. Thus, the current bullish move could come under pressure. |
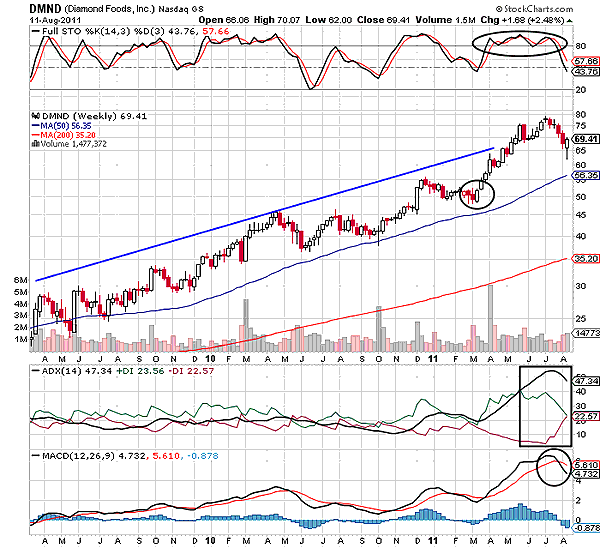
| DMND has formed a series of higher highs and higher lows on its weekly time frame chart in Figure 2. An advance rally that began in March 2011 reached a new high at $80 in July 2011. The price followed the direction of the 50-day MA support. After every bullish rally, DMND retraced toward the MA support. Since 2009, the stock moved parallel to the 50-day MA support. However, the rally from $50 was the only exception that surged away from the MA. Currently, the stock is plunging from the top due to an overheated uptrend. We can see that the ADX (14) was above 50 levels when the stock hit a new high. The stochastic oscillator was overbought for about three months, indicating a reversal possibility. The moving average convergence/divergence (MACD) (12,26,9) showed a bearish crossover in positive territory. Thus, it was difficult for DMND to sustain the new high. |

|
| FIGURE 2: DMND, WEEKLY |
| Graphic provided by: StockCharts.com. |
| |
| The stock plunged to $65, losing 15 points. The 50-day MA shows support at 56.35 levels. The price is likely to retrace toward the MA support. The momentum indicator is close to 50 levels, which is considered a major bullish support. The -DI is ready to surge above the +DI, suggesting increase in the selling pressure. Therefore, the medium-term chart in Figure 2 is indicating a bearish rally for DMND. |
| To conclude, an intermediate bullish rally of DMND would not sustain for the longer period. The bearish conditions on the weekly time frame chart would restrict the rally. |
Active trader in the Indian stock markets since 2003 and a full-time writer. Trading is largely based upon technical analysis.
| Company: | Independent |
| Address: | C1/3 Parth Indraprasth Towers. Vastrapur |
| Ahmedabad, Guj 380015 | |
| E-mail address: | chaitalimohile@yahoo.co.in |
Traders' Resource Links | |
| Independent has not added any product or service information to TRADERS' RESOURCE. | |
Click here for more information about our publications!
PRINT THIS ARTICLE

Request Information From Our Sponsors
- StockCharts.com, Inc.
- Candle Patterns
- Candlestick Charting Explained
- Intermarket Technical Analysis
- John Murphy on Chart Analysis
- John Murphy's Chart Pattern Recognition
- John Murphy's Market Message
- MurphyExplainsMarketAnalysis-Intermarket Analysis
- MurphyExplainsMarketAnalysis-Visual Analysis
- StockCharts.com
- Technical Analysis of the Financial Markets
- The Visual Investor
- VectorVest, Inc.
- Executive Premier Workshop
- One-Day Options Course
- OptionsPro
- Retirement Income Workshop
- Sure-Fire Trading Systems (VectorVest, Inc.)
- Trading as a Business Workshop
- VectorVest 7 EOD
- VectorVest 7 RealTime/IntraDay
- VectorVest AutoTester
- VectorVest Educational Services
- VectorVest OnLine
- VectorVest Options Analyzer
- VectorVest ProGraphics v6.0
- VectorVest ProTrader 7
- VectorVest RealTime Derby Tool
- VectorVest Simulator
- VectorVest Variator
- VectorVest Watchdog
