HOT TOPICS LIST
- MACD
- Fibonacci
- RSI
- Gann
- ADXR
- Stochastics
- Volume
- Triangles
- Futures
- Cycles
- Volatility
- ZIGZAG
- MESA
- Retracement
- Aroon
INDICATORS LIST
LIST OF TOPICS
PRINT THIS ARTICLE
by Andrew Hetherington
In recent months, several symmetrical triangles have broken to the downside on the chart for BCE Incorporated. What's in store for BCE, Inc., the Canadian telecom company?
Position: N/A
Andrew Hetherington
Classic Dow Theorist who trades as a pure technician, using pattern recognition.
PRINT THIS ARTICLE
TRIANGLES
Symmetrical Triangles - How the Mighty Have Fallen
04/08/02 02:11:58 PMby Andrew Hetherington
In recent months, several symmetrical triangles have broken to the downside on the chart for BCE Incorporated. What's in store for BCE, Inc., the Canadian telecom company?
Position: N/A
| The past 14 trading days has seen the Canadian behemoth BCE Incorporated (BCE) drop considerably from $21.93 down to a low of $17.21. This 21.5% drop in price seems less significant for most equities but for this steady widows and orphans haven it is disconcerting. |
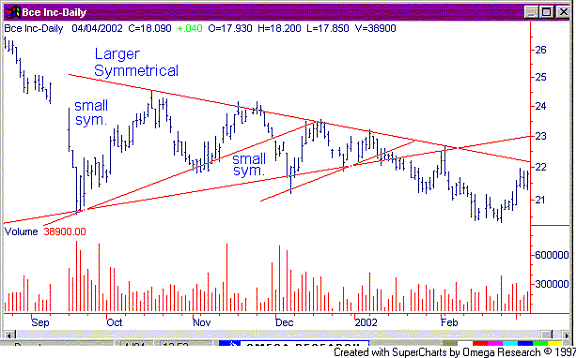
| Looking below in Figure 1 we see a series of three small symmetrical triangles. There is a 2-month symmetrical triangle, then a 1.5-month symmetrical triangle all within a larger 3.5-month symmetrical triangle. The volume on these patterns is diminished from left to right. All three of these patterns break on the downside, demonstrating the underlying weakness in this equity. The lack of demand was clearly visible and there was ample time to go to the sidelines and await the inevitable down move. |

|
| Figure 1: Daily chart for BCE. |
| Graphic provided by: SuperCharts. |
| |
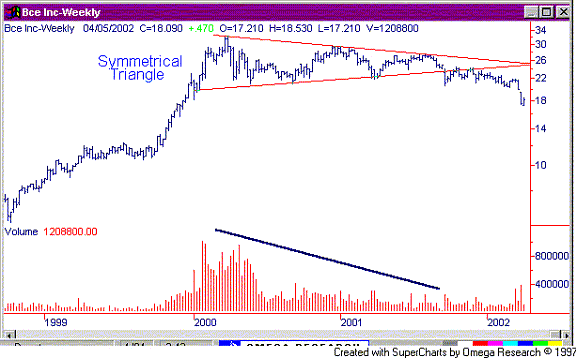
| Some would argue and quite rightly so, that a 21.5% down move is all part of the ebb and flow of any equity. This would be a valid thought except when you look at the bigger picture. Here in Figure 2 we see a much larger problem looming. |
 Figure 2: Weekly chart for BCE. On the weekly chart we see a very large and powerful 2-year symmetrical triangle. The volume is clearly diminished throughout this pattern and it breaks on the downside in the $24.00 area. The initial support was to be in the $17.00 area and eventually, it should reach the $15.50 area. If the weakness continues, it will likely drop to the next support level in the $12.00 - $13.00 area. It seems like a long way off to the bottom support but bear in mind, this is a large pattern with a significant drop in confidence. If I were banking my retirement income on this equity, I would have sold out on the breaking of the line in the $24.00 area. |
| As for the next few months it seems clear that any rally will have great difficulty in surpassing the new resistance levels in the $22.00 - $24.00 areas. Long-term investors cannot be satisfied with this erosion in their equities even though they have a significant dividend to consider. It's never easy giving up on such a dependable and safe performer. The support levels are very good entry points to buy a long position for those interested in accumulating for the longer term. |
Classic Dow Theorist who trades as a pure technician, using pattern recognition.
| Toronto, Canada |
Click here for more information about our publications!
Comments
Date: 04/08/02Rank: 5Comment: Great Article(S)--I really enjoy reading Andrew Hetherington s articles. His articles are very educational. Thank You So Much for these articles.
Date: 04/08/02Rank: 5Comment:
Date: 04/09/02Rank: 5Comment:
Date: 04/12/02Rank: 5Comment:
Date: 04/13/02Rank: 2Comment:
Date: 04/21/02Rank: 4Comment:

|

Request Information From Our Sponsors
- VectorVest, Inc.
- Executive Premier Workshop
- One-Day Options Course
- OptionsPro
- Retirement Income Workshop
- Sure-Fire Trading Systems (VectorVest, Inc.)
- Trading as a Business Workshop
- VectorVest 7 EOD
- VectorVest 7 RealTime/IntraDay
- VectorVest AutoTester
- VectorVest Educational Services
- VectorVest OnLine
- VectorVest Options Analyzer
- VectorVest ProGraphics v6.0
- VectorVest ProTrader 7
- VectorVest RealTime Derby Tool
- VectorVest Simulator
- VectorVest Variator
- VectorVest Watchdog
- StockCharts.com, Inc.
- Candle Patterns
- Candlestick Charting Explained
- Intermarket Technical Analysis
- John Murphy on Chart Analysis
- John Murphy's Chart Pattern Recognition
- John Murphy's Market Message
- MurphyExplainsMarketAnalysis-Intermarket Analysis
- MurphyExplainsMarketAnalysis-Visual Analysis
- StockCharts.com
- Technical Analysis of the Financial Markets
- The Visual Investor
