HOT TOPICS LIST
- MACD
- Fibonacci
- RSI
- Gann
- ADXR
- Stochastics
- Volume
- Triangles
- Futures
- Cycles
- Volatility
- ZIGZAG
- MESA
- Retracement
- Aroon
INDICATORS LIST
LIST OF TOPICS
PRINT THIS ARTICLE
by Matt Blackman
With the recent maelstrom in stocks, it is tempting to declare bottom with the first or second big rally. Here is why it pays to wait for confirmation.
Position: N/A
Matt Blackman
Matt Blackman is a full-time technical and financial writer and trader. He produces corporate and financial newsletters, and assists clients in getting published in the mainstream media. He is the host of TradeSystemGuru.com. Matt has earned the Chartered Market Technician (CMT) designation. Find out what stocks and futures Matt is watching on Twitter at www.twitter.com/RatioTrade
PRINT THIS ARTICLE
NEW HIGHS-NEW LOWS
Sounding For A Bottom?
08/12/11 02:18:10 PMby Matt Blackman
With the recent maelstrom in stocks, it is tempting to declare bottom with the first or second big rally. Here is why it pays to wait for confirmation.
Position: N/A
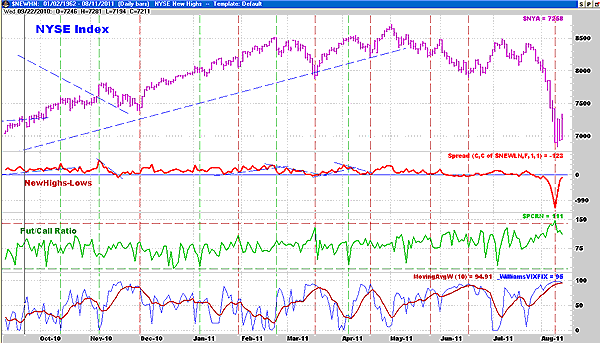
| In my May 2011 Working-Money.com article, "The Sonar Trio Bottom Sounder," I examined three indicators that could be used together to help confirm major turning points. They were new highs minus new lows (NH-NL), the put/call ratio (P/C), and the Williams VIX FIX (WVF). At the time, the last low shown in Figure 1 was in mid-March 2011 (seen in the middle of the chart). As we see, the index never moved below the dashed blue uptrend line for two months, so the trade was profitable. |

|
| FIGURE 1: NYSE INDEX, DAILY. Here are the three bottom-sounding indicators showing the bottom of August 8, 2011. |
| Graphic provided by: Chart courtesy GenesisFT.com. |
| |
| It was again tempting to call a bottom at the far right of the chart ending August 11, 2011, but there is good reason to wait for confirmation. On August 8, NYSE new highs minus lows (NH-NL) registered a bearish reading of -1303 and the put/call (P/C) ratio was an equally bearish 142. The Williams VIX (WVF) was also in extreme territory often seen at major lows. Looks like a pretty good bottom, doesn't it? But a glance back at history makes comparison worthwhile. At the last major low of the NYSE Index on March 6, 2009, the readings were NH-NL = -851, the P/C = 93, and the WVF had just come off a top. So compared to March 2009, the August 8, 2011, low looks more extreme. Should we buy? |
| Let's look back a little further. On July 15, 2008, the readings were NH-NL = -1285, P/C = 143, and the WVF had come off a top. Consequently, the NYSE index was cut in half so a buy would have been a decidedly bad idea. No uptrend was ever established so it was impossible to draw an uptrend line to exit. October 10, 2008, registered even greater extremes, with a NH-NL reading of -2590, a P/C of 107, and an extreme high reading in the WVF as well. But again the bounce was brief and the NYSE index still had more to fall before bottoming. Another extreme bottom reading occurred on November 10, 2008, and although an uptrend did start to build, it ended early in the New Year. |
| When the March 6, 2009, bottom was finally put in, bottom-pickers had either gotten very cautious or were broke in the three potential bottom-like extreme readings. But those who judiciously drew their trendlines and used them as trailing stops were well rewarded. The moral of the story is that major bottoms are rarely put in when bullishness abounds and the first rally has just occurred. Granted, it looked tempting with the pattern we're seeing in mid-August, but in this business, it pays to be more certain before investing your hard-won capital in the trade. |
| And when you finally decide to go long, don't overstay your trade if your stop gets taken out, hoping for the next rebound. Many traders before you have slowly but agonizingly gone broke, hoping for the recovery that waited until their trading capital was gone to appear. |
Matt Blackman is a full-time technical and financial writer and trader. He produces corporate and financial newsletters, and assists clients in getting published in the mainstream media. He is the host of TradeSystemGuru.com. Matt has earned the Chartered Market Technician (CMT) designation. Find out what stocks and futures Matt is watching on Twitter at www.twitter.com/RatioTrade
| Company: | TradeSystemGuru.com |
| Address: | Box 2589 |
| Garibaldi Highlands, BC Canada | |
| Phone # for sales: | 604-898-9069 |
| Fax: | 604-898-9069 |
| Website: | www.tradesystemguru.com |
| E-mail address: | indextradermb@gmail.com |
Traders' Resource Links | |
| TradeSystemGuru.com has not added any product or service information to TRADERS' RESOURCE. | |
Click here for more information about our publications!
PRINT THIS ARTICLE

Request Information From Our Sponsors
- VectorVest, Inc.
- Executive Premier Workshop
- One-Day Options Course
- OptionsPro
- Retirement Income Workshop
- Sure-Fire Trading Systems (VectorVest, Inc.)
- Trading as a Business Workshop
- VectorVest 7 EOD
- VectorVest 7 RealTime/IntraDay
- VectorVest AutoTester
- VectorVest Educational Services
- VectorVest OnLine
- VectorVest Options Analyzer
- VectorVest ProGraphics v6.0
- VectorVest ProTrader 7
- VectorVest RealTime Derby Tool
- VectorVest Simulator
- VectorVest Variator
- VectorVest Watchdog
- StockCharts.com, Inc.
- Candle Patterns
- Candlestick Charting Explained
- Intermarket Technical Analysis
- John Murphy on Chart Analysis
- John Murphy's Chart Pattern Recognition
- John Murphy's Market Message
- MurphyExplainsMarketAnalysis-Intermarket Analysis
- MurphyExplainsMarketAnalysis-Visual Analysis
- StockCharts.com
- Technical Analysis of the Financial Markets
- The Visual Investor
