HOT TOPICS LIST
- MACD
- Fibonacci
- RSI
- Gann
- ADXR
- Stochastics
- Volume
- Triangles
- Futures
- Cycles
- Volatility
- ZIGZAG
- MESA
- Retracement
- Aroon
INDICATORS LIST
LIST OF TOPICS
PRINT THIS ARTICLE
by Mike Carr, CMT
The recent market turmoil feels like it is unprecedented in terms of volatility for the Dow Jones Industrial Average, but it's not even close to what traders experienced in 1987 or 1929.
Position: Sell
Mike Carr, CMT
Mike Carr, CMT, is a member of the Market Technicians Association, and editor of the MTA's newsletter, Technically Speaking. He is also the author of "Smarter Investing in Any Economy: The Definitive Guide to Relative Strength Investing," and "Conquering the Divide: How to Use Economic Indicators to Catch Stock Market Trends."
PRINT THIS ARTICLE
AVERAGE TRUE RANGE
Stocks Half As Volatile Now As In Great Crashes
08/11/11 08:39:36 AMby Mike Carr, CMT
The recent market turmoil feels like it is unprecedented in terms of volatility for the Dow Jones Industrial Average, but it's not even close to what traders experienced in 1987 or 1929.
Position: Sell
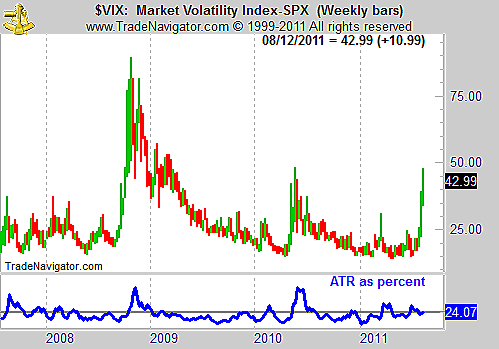
| Volatility is frequently expressed in terms of VIX, the widely followed index of stock market volatility. VIX has a long history but only goes back to 1990, missing the largest market crashes of the 20th century. The VIX is at high levels and is trading where it was in spring 2010. This was not an especially volatile time in stocks and shows that VIX represents a relative measure of market volatility. Its absolute value is not the best indicator of volatility. Average true range can also be used to find volatility. Dividing the ATR by the close will allow it be compared across any market or offer a historical view. This is shown for the VIX in Figure 1 and by that measure, volatility in the VIX occurs fairly frequently. |

|
| FIGURE 1: VIX VOLATILITY. VIX volatility, measured by the ATR as a percent of the close, has often been higher than it is now. |
| Graphic provided by: Trade Navigator. |
| |
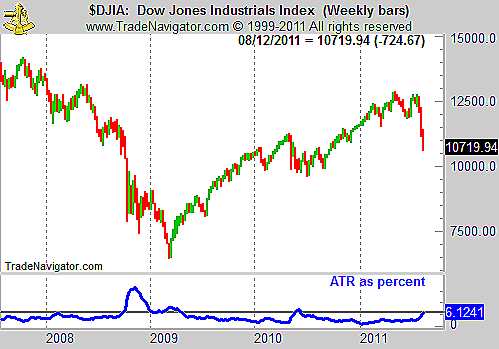
| The Dow Jones Industrial Average (DJIA) is also behaving relatively tamely by this measure. It sits at about 6%, compared with more than 16% during October and November 2008. See Figure 2. |

|
| FIGURE 2: DJIA, WEEKLY. Volatility was more than twice as high as it is now in autumn 2008. |
| Graphic provided by: Trade Navigator. |
| |
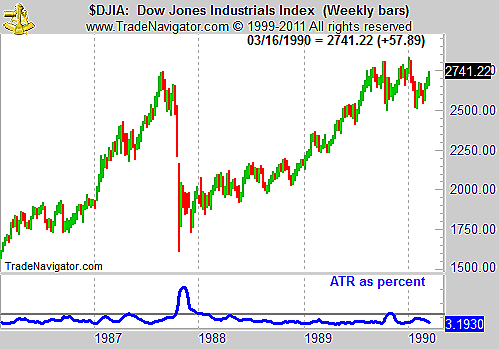
| The market crash of 1987 is shown in Figure 3, when this measure peaked just over 15%, below the level reached in the 2008 crash. |

|
| FIGURE 3: DJIA, WEEKLY. The October 1987 crash was quicker and deeper in price than the current decline. |
| Graphic provided by: Trade Navigator. |
| |
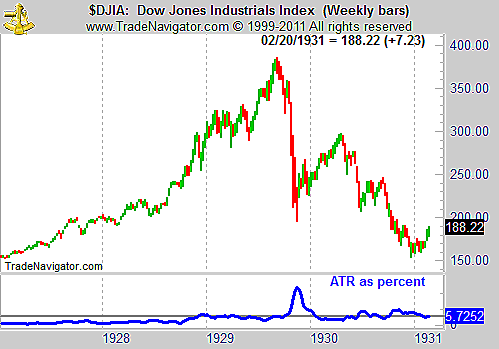
| Figure 4 shows the 1929 crash, which was the most volatile market period. The ATR peaked at 23.9% of the closing price. |

|
| FIGURE 4: DJIA, WEEKLY. The 1929 stock market crash ushered in the Great Depression and was the most volatile in stock market history. |
| Graphic provided by: Trade Navigator. |
| |
| Volatility in the current market has risen sharply but could go much higher if history is a guide. However, that would require a major market crash from this level, an unlikely event after the recent declines. |
Mike Carr, CMT, is a member of the Market Technicians Association, and editor of the MTA's newsletter, Technically Speaking. He is also the author of "Smarter Investing in Any Economy: The Definitive Guide to Relative Strength Investing," and "Conquering the Divide: How to Use Economic Indicators to Catch Stock Market Trends."
| Website: | www.moneynews.com/blogs/MichaelCarr/id-73 |
| E-mail address: | marketstrategist@gmail.com |
Click here for more information about our publications!
PRINT THIS ARTICLE

Request Information From Our Sponsors
- StockCharts.com, Inc.
- Candle Patterns
- Candlestick Charting Explained
- Intermarket Technical Analysis
- John Murphy on Chart Analysis
- John Murphy's Chart Pattern Recognition
- John Murphy's Market Message
- MurphyExplainsMarketAnalysis-Intermarket Analysis
- MurphyExplainsMarketAnalysis-Visual Analysis
- StockCharts.com
- Technical Analysis of the Financial Markets
- The Visual Investor
- VectorVest, Inc.
- Executive Premier Workshop
- One-Day Options Course
- OptionsPro
- Retirement Income Workshop
- Sure-Fire Trading Systems (VectorVest, Inc.)
- Trading as a Business Workshop
- VectorVest 7 EOD
- VectorVest 7 RealTime/IntraDay
- VectorVest AutoTester
- VectorVest Educational Services
- VectorVest OnLine
- VectorVest Options Analyzer
- VectorVest ProGraphics v6.0
- VectorVest ProTrader 7
- VectorVest RealTime Derby Tool
- VectorVest Simulator
- VectorVest Variator
- VectorVest Watchdog
