HOT TOPICS LIST
- MACD
- Fibonacci
- RSI
- Gann
- ADXR
- Stochastics
- Volume
- Triangles
- Futures
- Cycles
- Volatility
- ZIGZAG
- MESA
- Retracement
- Aroon
INDICATORS LIST
LIST OF TOPICS
PRINT THIS ARTICLE
by Chaitali Mohile
Stamps.com has emerged out of a long consolidation period. Will the bullish breakout pull the stock higher?
Position: N/A
Chaitali Mohile
Active trader in the Indian stock markets since 2003 and a full-time writer. Trading is largely based upon technical analysis.
PRINT THIS ARTICLE
BREAKOUTS
STMP Ready To Surge?
08/10/11 02:33:09 PMby Chaitali Mohile
Stamps.com has emerged out of a long consolidation period. Will the bullish breakout pull the stock higher?
Position: N/A
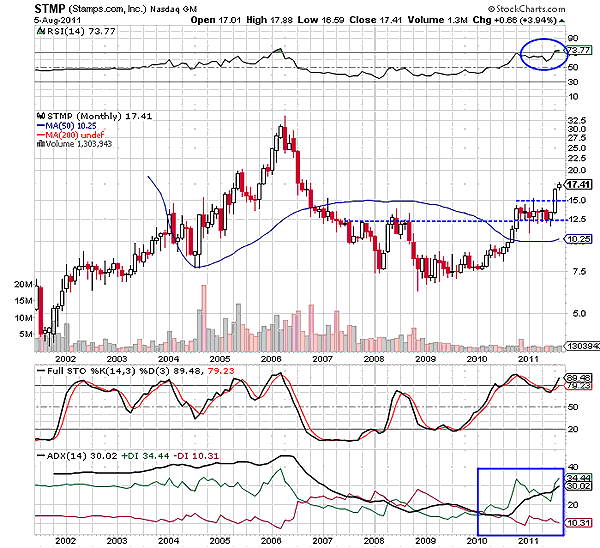
| The $7.50 level is a robust support for Stamps.com (STMP) on its monthly time frame chart in Figure 1. In the past few years, this support was challenged periodically. The stock consolidated in 2002-03 at $7.50, a short-term correction in 2004, and a huge turmoil of 2006 established support here. In 2008, STMP surged from $7.50 levels but could not succeed above $12.50 levels, forming a psychological resistance. Thereafter, the stock moved sideways for a year, forming a rounded bottom. The bottom formed at $7.50 levels is a bullish reversal formation. The pattern converted the $12.50 level resistance to support in December 2010 and moved horizontally. The 50-day moving average (MA) resistance has been broken. Therefore, a bullish breakout of the pattern could lead to a healthy rally in the future. But we can see in Figure 1 that the price was consolidating with the historical support at $12.50 levels. |

|
| FIGURE 1: STMP, MONTHLY |
| Graphic provided by: StockCharts.com. |
| |
| Thus, the pattern did not break immediately after breaching resistance in Figure 1. The long consolidation range of STMP was recently violated. The relative strength index (RSI) (14) has surged above 70 levels. Earlier, the indicator failed to sustain above this level, and therefore, it is essential to watch the oscillator in the current scenario. If the RSI (14) sustains in the overbought region, then the breakout is likely to succeed. The average directional index (ADX) (14) is indicating a developed uptrend, and the full stochastic (14,3,3) is overbought. Considering all three indicators, STMP's breakout is likely to proceed at a slower pace. |

|
| FIGURE 2: STMP, WEEKLY |
| Graphic provided by: StockCharts.com. |
| |
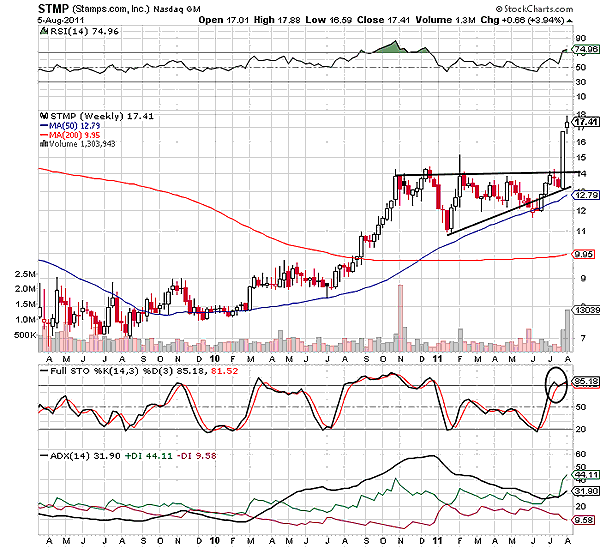
| After a small advance rally, STMP has formed an ascending triangle on the weekly time frame in Figure 2. Therefore, the triangle is considered as a bullish flag & pennant formation. The pattern has already broken upward with a long white bullish candle. The big bullish candle was due to a huge gap breakout on the intraday chart (see the daily time frame). STMP has initiated a fresh rally above the previous big candle. Since the uptrend is surging in the well-developed region, the rally would continue its journey. The overbought oscillators (the RSI (14) and full stochastic) have enough space to glide in the region. Thus, technically, the breakout rally could surge higher. The price rally can retrace toward the newly formed support at 14 levels in Figure 2, which would open a fresh buying opportunity for long-term traders. Currently, STMP is likely to consolidate in the narrow range of 18-16. |
| However, the ongoing turmoil in the financial market would affect the price rally of STMP. Due to high volatility, the stock is likely to plunge a few points from current levels. Therefore, short-term traders would find it difficult to ride the rally, but long-term investors can remain long. Technically, STMP is one of the strongest and reliable stocks. |
Active trader in the Indian stock markets since 2003 and a full-time writer. Trading is largely based upon technical analysis.
| Company: | Independent |
| Address: | C1/3 Parth Indraprasth Towers. Vastrapur |
| Ahmedabad, Guj 380015 | |
| E-mail address: | chaitalimohile@yahoo.co.in |
Traders' Resource Links | |
| Independent has not added any product or service information to TRADERS' RESOURCE. | |
Click here for more information about our publications!
PRINT THIS ARTICLE

Request Information From Our Sponsors
- StockCharts.com, Inc.
- Candle Patterns
- Candlestick Charting Explained
- Intermarket Technical Analysis
- John Murphy on Chart Analysis
- John Murphy's Chart Pattern Recognition
- John Murphy's Market Message
- MurphyExplainsMarketAnalysis-Intermarket Analysis
- MurphyExplainsMarketAnalysis-Visual Analysis
- StockCharts.com
- Technical Analysis of the Financial Markets
- The Visual Investor
- VectorVest, Inc.
- Executive Premier Workshop
- One-Day Options Course
- OptionsPro
- Retirement Income Workshop
- Sure-Fire Trading Systems (VectorVest, Inc.)
- Trading as a Business Workshop
- VectorVest 7 EOD
- VectorVest 7 RealTime/IntraDay
- VectorVest AutoTester
- VectorVest Educational Services
- VectorVest OnLine
- VectorVest Options Analyzer
- VectorVest ProGraphics v6.0
- VectorVest ProTrader 7
- VectorVest RealTime Derby Tool
- VectorVest Simulator
- VectorVest Variator
- VectorVest Watchdog
