HOT TOPICS LIST
- MACD
- Fibonacci
- RSI
- Gann
- ADXR
- Stochastics
- Volume
- Triangles
- Futures
- Cycles
- Volatility
- ZIGZAG
- MESA
- Retracement
- Aroon
INDICATORS LIST
LIST OF TOPICS
PRINT THIS ARTICLE
by Donald W. Pendergast, Jr.
The bear is back, much to some analysts' surprise. Based on cycle and Fibonacci analysis, traders and investors shouldn't expect to see a major rally again in the .SPX until the 1000-1025 area is convincingly tested.
Position: N/A
Donald W. Pendergast, Jr.
Donald W. Pendergast is a financial markets consultant who offers specialized services to stock brokers and high net worth individuals who seek a better bottom line for their portfolios.
PRINT THIS ARTICLE
FIBONACCI
S&P 500 Another 100 Points Until A Bottom?
08/09/11 11:41:25 AMby Donald W. Pendergast, Jr.
The bear is back, much to some analysts' surprise. Based on cycle and Fibonacci analysis, traders and investors shouldn't expect to see a major rally again in the .SPX until the 1000-1025 area is convincingly tested.
Position: N/A
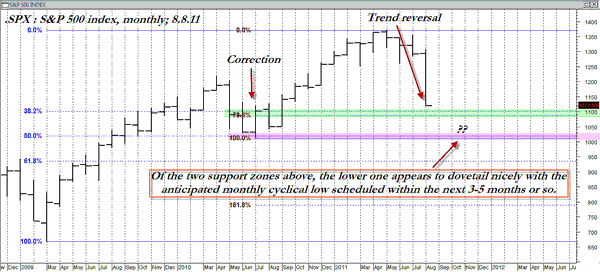
| The price action of the last couple of weeks is eerily reminiscent of that ocurring during the summer of 2002, August 1998, and the autumn of 2008. The big question here is this: Can the .SPX find a meaningful support area soon, and, if so, just how far back up might it try to rise before stalling out again? We'll look at a monthly chart of the .SPX and see what it appears to be informing traders and investors about. |

|
| FIGURE 1: SPX, MONTHLY. Support near 1100 might hold back the selling temporarily, but the cyclical pattern in this market suggests that the zone near 1000-1020 is more likely to offer meaningful support, should the selling finally become exhausted. |
| Graphic provided by: MetaStock. |
| |
| Monthly charts can often be used to help give long-term investors a general sense of trend and cycle strength in a given market, particularly in the broad stock indexes like the .SPX. In Figure 1, we can easily see the two powerful monthly up waves that commenced after the major low was completed in March 2009; the first wave lasted 14 months and tacked on 553 points, while the more recent wave higher was only able to muster 359.67 points. The first pullback after the first wave's high was made is considered to be a normal corrective move in a healthy bull market, while the downswing now in force is more of a full-blown trend reversal move. On the chart, you'll notice the two distinct Fibonacci confluence support areas; the first one (green shaded area) resides near the 1100 level and is formed by the agreement of the 79% retracement of the second up wave with the 38% retracement of the entire up move since March 2009. Expect this particular support area to be tested as soon as Tuesday, August 9 2011. Just below that is another Fibonacci confluence agreement, this time it's the marriage of support near 1010 and 1020 (pink shaded), and this is the price zone that has the best chance of offering lasting support. Whichever one initially holds back the flood (so to speak) of selling is almost certain to face a re-test before any kind of a sustained market rebound can occur. This is a good time to start preparing a shopping list of high-quality stocks with above-average earnings growth potential, but it's still too early to start deploying that cash -- especially before those support zones are tested, retested, and confirmed. Be patient and pick your entry spot well and you'll probably do a lot better than those who simply attempt to call a bottom, rush in to buy, and then get their heads handed to them by Mister Market. |
Donald W. Pendergast is a financial markets consultant who offers specialized services to stock brokers and high net worth individuals who seek a better bottom line for their portfolios.
| Title: | Writer, market consultant |
| Company: | Linear Trading Systems LLC |
| Jacksonville, FL 32217 | |
| Phone # for sales: | 904-239-9564 |
| E-mail address: | lineartradingsys@gmail.com |
Traders' Resource Links | |
| Linear Trading Systems LLC has not added any product or service information to TRADERS' RESOURCE. | |
Click here for more information about our publications!
PRINT THIS ARTICLE

Request Information From Our Sponsors
- StockCharts.com, Inc.
- Candle Patterns
- Candlestick Charting Explained
- Intermarket Technical Analysis
- John Murphy on Chart Analysis
- John Murphy's Chart Pattern Recognition
- John Murphy's Market Message
- MurphyExplainsMarketAnalysis-Intermarket Analysis
- MurphyExplainsMarketAnalysis-Visual Analysis
- StockCharts.com
- Technical Analysis of the Financial Markets
- The Visual Investor
- VectorVest, Inc.
- Executive Premier Workshop
- One-Day Options Course
- OptionsPro
- Retirement Income Workshop
- Sure-Fire Trading Systems (VectorVest, Inc.)
- Trading as a Business Workshop
- VectorVest 7 EOD
- VectorVest 7 RealTime/IntraDay
- VectorVest AutoTester
- VectorVest Educational Services
- VectorVest OnLine
- VectorVest Options Analyzer
- VectorVest ProGraphics v6.0
- VectorVest ProTrader 7
- VectorVest RealTime Derby Tool
- VectorVest Simulator
- VectorVest Variator
- VectorVest Watchdog
