
HOT TOPICS LIST
- MACD
- Fibonacci
- RSI
- Gann
- ADXR
- Stochastics
- Volume
- Triangles
- Futures
- Cycles
- Volatility
- ZIGZAG
- MESA
- Retracement
- Aroon
INDICATORS LIST
LIST OF TOPICS
PRINT THIS ARTICLE
by David Penn
From new highs to countertrend reversals, there is more than one way to trade the utilities stocks.
Position: N/A
David Penn
Technical Writer for Technical Analysis of STOCKS & COMMODITIES magazine, Working-Money.com, and Traders.com Advantage.
PRINT THIS ARTICLE
SECTOR INVESTING
Trends in Utilities
04/09/02 08:44:25 AMby David Penn
From new highs to countertrend reversals, there is more than one way to trade the utilities stocks.
Position: N/A
| I noted a month ago the developing double bottom in the Dow Jones Utilities Average ("A Double Bottom in Utilities", March 7, 2002, Traders.com). Since that time, the DJUA has broken out on the upside, corrected, rallied past resistance again and now sits in a nine-day consolidation range between 300 and 306 (there is intraday trading above 306 that goes as high as 308.5, but the size of this "topping tail" and its location in the rally is somewhat bearish). While the big money investing in utilities so far has come during the DJUA's mid-February advance from 273 to 300 by the mid-March breakout, there may be more upside to the utilities average should prices break free from their current consolidation. |
| How does the action in the DJUA reflect on the actual components of the Average? Are most of the DJUA components making bottoming patterns? How many are breaking out above resistance areas? A look at the 15 members of the DJUA suggests there are two types of advancing utilities stock in the DJUA--those that are in continuing uptrends and those that are rallying sharply after a countertrend rally (or even a short, nine-month bear market). |
|
| Graphic provided by: MetaStock. |
| |
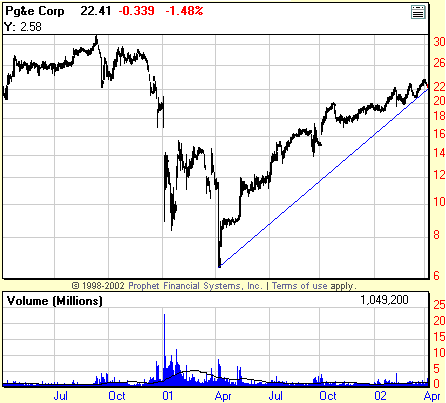
The first kind of DJUA stock worth considering should the Average continue to advance is represented by stocks like PG&E (PCG), Southern Company (SO), and, to a lesser degree, TXU Corporation (TXU). These are all stocks that have been in fairly solid uptrends--the most recent moving up in December 2001. PCG, in particular, has remained especially resilient, advancing 242% since bottoming in April 2001, with only the slightest of corrections during the September 11th terrorist-oriented declines.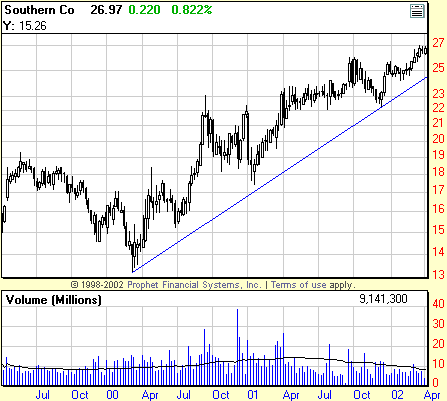 Southern Company (SO) has enjoyed an advance similar to that of PCG. SO bottomed in March 2000 at 14.20 and was trading recently at about 27, a 90% return in about two years. SO has also recently moved above resistance at about 26, the high point of the most recent previous rally. TXU Corporation falls into this category as well. TXU bottomed in March 2000 at 26, and has gained about 108% in the two years since. In spite of some sideways movement during most of 2001, TXU began moving upward strongly again in December of that year and is already up 12.5% for the year. SO and PCG are up 6.5% and 18% respectively. 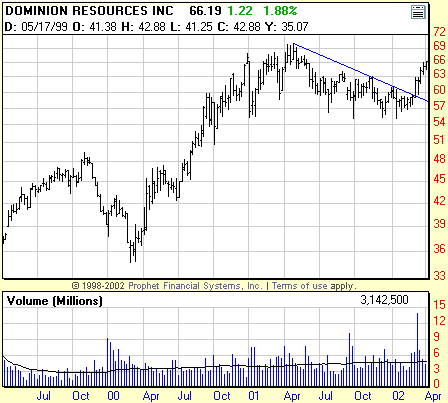 A new bull market for Dominion Resources could be in the making should the bull market confirmation point at 63 prove to be solid support. The other kind of Dow utilities stock also bottomed in the spring of 2000. However, these stocks also suffered significant declines in the last three-quarters of 2001, topping out in the spring of that year. An example of this phenomenon is in the price chart for Dominion Resources (D). Note how Dominion Resources reached a top in early April 2001 after an advance of 101% from the March 2000 bottom. The correction from this advance took a mere 16% off the top before Dominion Resources rallied again. Using the bull market confirmation technique (introduced in "Russia Rising", March 22, 2002, Traders.com Advantage), we can surmise that Dominion Resources began another bull market with the advance beyond the bear market rally high of 63. This point becomes the new source of support should shares of Dominion Resources again correct. |
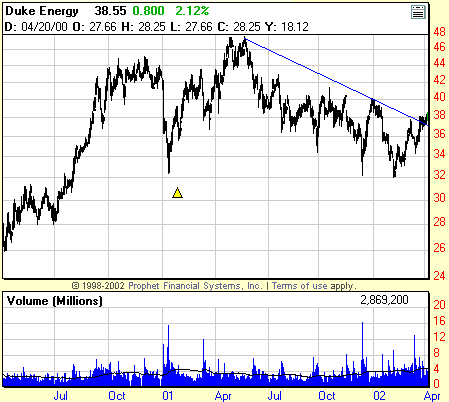 Other examples of utilities stocks that declined for much of 2001 (after a strong bull market in 2000) are Duke Energy (DUK) and American Electric Power (AEP). Both of these stocks participated in the March 2000 decline and bottom, and both stocks rallied strongly until topping out in April 2001 (Duke gained 109% over this period; American gained just over 97%). Duke Energy, following its top, corrected some 33% before rallying in early February. American Electric Power fell almost 23% before its rally began--also in early February. |
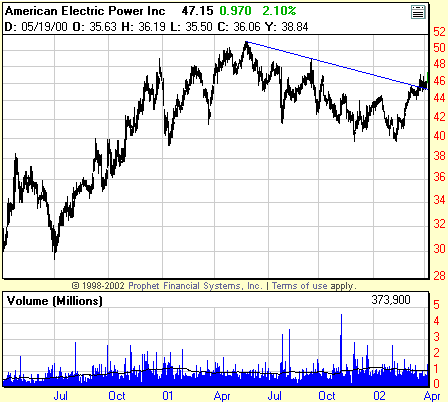 But what we need to know about these stocks that declines through most of 2001 is: when will we know when bull markets are in place? Again, I turn to the bull market confirmation technique of marking the highest point in the most recently ended (or so we assume at the time) bear market. This point serves as significant resistance to any new advance, and any advance that successfully tests this resistance point is strongly indicative of a new trend. Looking at DUK and AEP, we note that neither stock has yet to reach its bull market confirmation point. Duke Energy's bull market confirmation point is just above 40, and shares of American Electric Power would need to climb to about 48.90--although the successful test of resistance at 44 is promising for those considering long opportunities in AEP. |
Technical Writer for Technical Analysis of STOCKS & COMMODITIES magazine, Working-Money.com, and Traders.com Advantage.
| Title: | Technical Writer |
| Company: | Technical Analysis, Inc. |
| Address: | 4757 California Avenue SW |
| Seattle, WA 98116 | |
| Phone # for sales: | 206 938 0570 |
| Fax: | 206 938 1307 |
| Website: | www.Traders.com |
| E-mail address: | DPenn@traders.com |
Traders' Resource Links | |
| Charting the Stock Market: The Wyckoff Method -- Books | |
| Working-Money.com -- Online Trading Services | |
| Traders.com Advantage -- Online Trading Services | |
| Technical Analysis of Stocks & Commodities -- Publications and Newsletters | |
| Working Money, at Working-Money.com -- Publications and Newsletters | |
| Traders.com Advantage -- Publications and Newsletters | |
| Professional Traders Starter Kit -- Software | |
Click here for more information about our publications!
Comments

|

Request Information From Our Sponsors
- StockCharts.com, Inc.
- Candle Patterns
- Candlestick Charting Explained
- Intermarket Technical Analysis
- John Murphy on Chart Analysis
- John Murphy's Chart Pattern Recognition
- John Murphy's Market Message
- MurphyExplainsMarketAnalysis-Intermarket Analysis
- MurphyExplainsMarketAnalysis-Visual Analysis
- StockCharts.com
- Technical Analysis of the Financial Markets
- The Visual Investor
- VectorVest, Inc.
- Executive Premier Workshop
- One-Day Options Course
- OptionsPro
- Retirement Income Workshop
- Sure-Fire Trading Systems (VectorVest, Inc.)
- Trading as a Business Workshop
- VectorVest 7 EOD
- VectorVest 7 RealTime/IntraDay
- VectorVest AutoTester
- VectorVest Educational Services
- VectorVest OnLine
- VectorVest Options Analyzer
- VectorVest ProGraphics v6.0
- VectorVest ProTrader 7
- VectorVest RealTime Derby Tool
- VectorVest Simulator
- VectorVest Variator
- VectorVest Watchdog
