HOT TOPICS LIST
- MACD
- Fibonacci
- RSI
- Gann
- ADXR
- Stochastics
- Volume
- Triangles
- Futures
- Cycles
- Volatility
- ZIGZAG
- MESA
- Retracement
- Aroon
INDICATORS LIST
LIST OF TOPICS
PRINT THIS ARTICLE
by Alan R. Northam
Statistical analysis shows gold remains in a strong long-term uptrend.
Position: N/A
Alan R. Northam
Alan Northam lives in the Dallas, Texas area and as an electronic engineer gave him an analytical mind from which he has developed a thorough knowledge of stock market technical analysis. His abilities to analyze the future direction of the stock market has allowed him to successfully trade of his own portfolio over the last 30 years. Mr. Northam is now retired and trading the stock market full time. You can reach him at inquiry@tradersclassroom.com or by visiting his website at http://www.tradersclassroom.com. You can also follow him on Twitter @TradersClassrm.
PRINT THIS ARTICLE
STATISTICS
Gold Remains In Long-Term Uptrend
08/08/11 12:35:08 PMby Alan R. Northam
Statistical analysis shows gold remains in a strong long-term uptrend.
Position: N/A
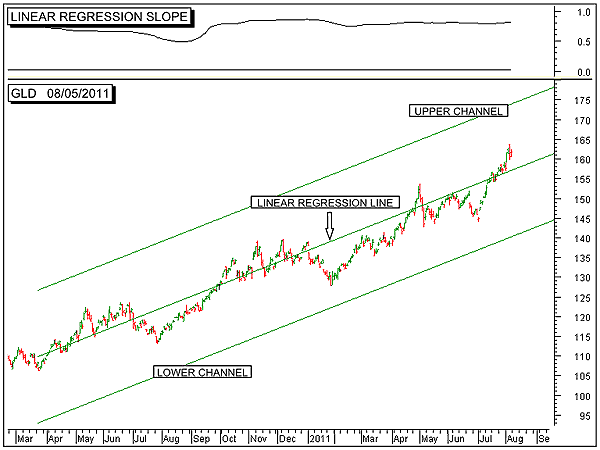
| Figure 1 shows the long-term picture of the SPDR Gold Shares exchange traded fund (ETF)(GLD). The bottom panel of Figure 1 shows the daily trading bars along with the 200-day linear regression trendline and its upper and lower two sigma channel lines. As long as the daily price bars remain inside these upper and lower channel lines, the long-term trend of gold statistically remains in an uptrend. A breakdown below the lower channel line would signal a major trend reversal for this precious metal. The upper panel of Figure 1 shows the R-squared indicator. This indicator is a measure of the strength of the trend. The R-squared indicator is currently reading 0.81, signaling a strong long-term uptrend in gold in play. |

|
| FIGURE 1: .DJI, DAILY. This chart shows the daily price chart of the SPDR Gold Shares ETF (GLD) in the bottom panel along with its 200-day linear regression trendline as well as its upper and lower two sigma channel lines. The linear regression slope indicator is shown in the top panel. |
| Graphic provided by: MetaStock. |
| |
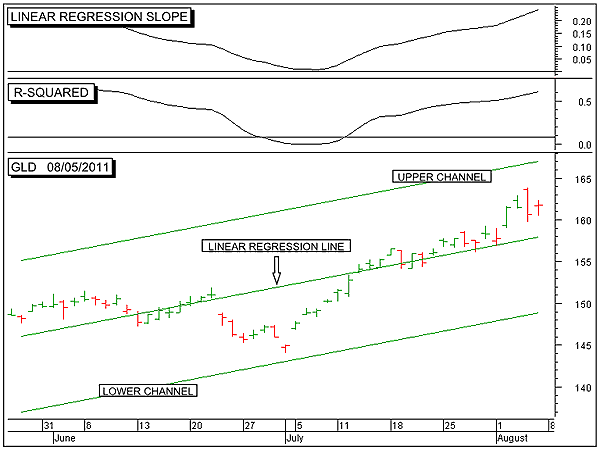
| Figure 2 shows GLD over the intermediate term. The bottom panel of Figure 2 shows the daily price bars along with its 50-day linear regression trendline and upper and lower two sigma channel lines. Note that the linear regression trendline and its upper and lower channel lines are sloping in an upward direction, indicating that the intermediate-term trend in gold is up. The linear regression slope indicator in the top panel continues to point upward, signaling that price is currently accelerating in an upward direction. Note that a trend normally has three basic stages, a basing stage, an acceleration stage, and a topping stage. Thus, the current acceleration stage is an indication that the intermediate-term trend still has further to run before reversing to the downside. The R-squared indicator is also pointing upward, indicating that the acceleration stage continues to get stronger, a signal that the acceleration stage is not yet complete. Once the acceleration stage is complete, then the topping stage should begin where price actually starts to decelerate in preparation for a reversal downward. |

|
| FIGURE 2: .DJI, DAILY. This chart shows the daily price chart of the SPDR Gold Shares ETF (GLD) in the bottom panel along with its 50-day linear regression trendline as well as its upper and lower two sigma channel lines. The linear regression slope indicator is shown in the top panel, and the R-squared indicator in the second panel. |
| Graphic provided by: MetaStock. |
| |
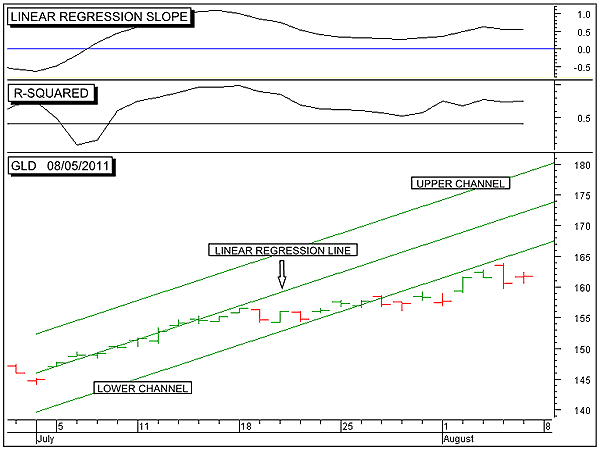
| Figure 3 shows the short-term trend of GLD. On the price chart, in the bottom panel, is shown the 10-day linear regression trendline along with its upper and lower two sigma channel lines. Note that price has now moved below the lower channel line, sending a warning that the short-term trend is in its topping stage. This topping stage is also confirmed by the linear regression slope indicator in the top panel of Figure 3. Here we can see that this indicator peaked in mid-July and is now working its way lower. This is an indication that price is now in the short-term deceleration phase, which normally occurs just before a reversal in trend. In addition, note that the R-squared indicator, in Figure 3, peaked in July and is working its way lower. This is an indication that the short-term trend is weakening. |

|
| FIGURE 3: .DJI, DAILY. This chart shows the daily price chart of the SPDR Gold Shares ETF (GLD) in the bottom panel along with its 10-day extended linear regression trendline and upper and lower two sigma channel lines. The linear regression slope indicator is shown in the top panel, and the R-squared indicator is also shown in the second panel. |
| Graphic provided by: MetaStock. |
| |
| In conclusion, this statistical analysis shows that the long-term and intermediate-term uptrends in gold remain intact. However, over the short term it looks like gold may have run its course and is close to reversing downward. Here's what to expect: Once the short-term trend reverses downward, expect price to move back down to the lower two sigma intermediate-term channel line. At this point, price should once again reverse back upward as the trend over the intermediate term is upward. However, a breakdown below the lower two sigma intermediate-term channel line would be a warning that the intermediate-term upward trend in gold has run its course. Once the intermediate-term trend reverses to the downside, expect price to continue lower until it reaches the lower two sigma long-term channel line. At this point, expect price to reverse back upward as the long-term trend in gold is still in the upward direction. However, a breakdown of the long-term lower two sigma channel line would then be a warning that the long-term trend in gold is reversing downward. The bottom line is that a trend in motion stays in motion until proven otherwise. Therefore, as long as the long-term channel lines are not violated, gold remains in the upward direction and any intermediate-term downward reversal of trend is to be considered a correction within the long-term uptrend. |
Alan Northam lives in the Dallas, Texas area and as an electronic engineer gave him an analytical mind from which he has developed a thorough knowledge of stock market technical analysis. His abilities to analyze the future direction of the stock market has allowed him to successfully trade of his own portfolio over the last 30 years. Mr. Northam is now retired and trading the stock market full time. You can reach him at inquiry@tradersclassroom.com or by visiting his website at http://www.tradersclassroom.com. You can also follow him on Twitter @TradersClassrm.
| Garland, Tx | |
| Website: | www.tradersclassroom.com |
| E-mail address: | inquiry@tradersclassroom.com |
Click here for more information about our publications!
PRINT THIS ARTICLE

|

Request Information From Our Sponsors
- StockCharts.com, Inc.
- Candle Patterns
- Candlestick Charting Explained
- Intermarket Technical Analysis
- John Murphy on Chart Analysis
- John Murphy's Chart Pattern Recognition
- John Murphy's Market Message
- MurphyExplainsMarketAnalysis-Intermarket Analysis
- MurphyExplainsMarketAnalysis-Visual Analysis
- StockCharts.com
- Technical Analysis of the Financial Markets
- The Visual Investor
- VectorVest, Inc.
- Executive Premier Workshop
- One-Day Options Course
- OptionsPro
- Retirement Income Workshop
- Sure-Fire Trading Systems (VectorVest, Inc.)
- Trading as a Business Workshop
- VectorVest 7 EOD
- VectorVest 7 RealTime/IntraDay
- VectorVest AutoTester
- VectorVest Educational Services
- VectorVest OnLine
- VectorVest Options Analyzer
- VectorVest ProGraphics v6.0
- VectorVest ProTrader 7
- VectorVest RealTime Derby Tool
- VectorVest Simulator
- VectorVest Variator
- VectorVest Watchdog
