HOT TOPICS LIST
- MACD
- Fibonacci
- RSI
- Gann
- ADXR
- Stochastics
- Volume
- Triangles
- Futures
- Cycles
- Volatility
- ZIGZAG
- MESA
- Retracement
- Aroon
INDICATORS LIST
LIST OF TOPICS
PRINT THIS ARTICLE
by Koos van der Merwe
Elliott wave theory offers a signpost in the wilderness.
Position: Accumulate
Koos van der Merwe
Has been a technical analyst since 1969, and has worked as a futures and options trader with First Financial Futures in Johannesburg, South Africa.
PRINT THIS ARTICLE
ELLIOTT WAVE
Help! Where Are We?
08/05/11 09:02:50 AMby Koos van der Merwe
Elliott wave theory offers a signpost in the wilderness.
Position: Accumulate
| The market dropped alarmingly on Thursday, August 4. The bears came out in force and shouted from the rooftops, "You see? We are right!" With the European crises on everyone's plate, the bears were shouting that Spain and Portugal, or was it Ireland? would be the next Greece. With the Republicans in Congress playing politics rather than looking after the US economy, and with a general uncertainty and fear among investors who typically sell as the market bottoms, the indexes fell heavily. Yes, a recession was still a possibility, and my long-term charts comparing the trend of the present market to a similar pattern in the 1970s (see my article, "Today's K-Wave," S&C April 2011) do suggest a saucer-shaped dip bottoming in the coming 12 months. That could be nasty, but I don't believe it will occur. Charts are suggesting that the dip will be mild, prolonged, but rather depressing. |

|
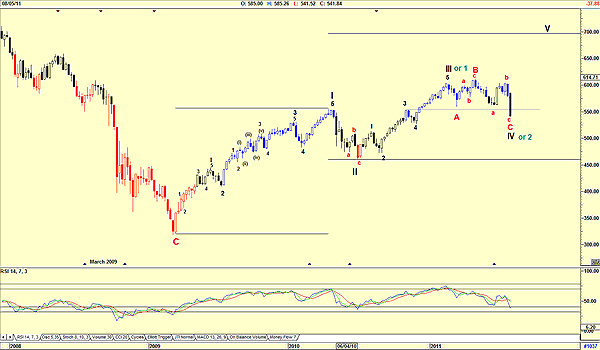
| FIGURE 1. S&P 100, WEEKLY |
| Graphic provided by: AdvancedGET. |
| |
| Figure 1 is a weekly Standard & Poor's 100 index. My Elliott wave count does follow the first rule of Elliott wave theory, namely that the chart must look correct. The wave count does look correct, with a large "however." The wave count in black suggests that waves III and IV have been completed by August 4's action. Wave IV has finished within the fourth wave of lesser degree, which does mean that the index should now rise into a wave V. This is confirmed by the relative strength index (RSI), which is at oversold levels. However, wave III is less than wave I, which means that wave V should be less than wave III. The top of wave V, if history proves correct, should occur sometime in October. In addition, a flat wave V does seem possible because September is notorious for being the quietest month of the year. |
| On the optimistic side, however, suggesting that I could be wrong in my article, I have shown that wave III could be wave 1 of wave III and that wave IV could be wave 2 of wave IV. I sincerely hope that this will be the case, but with all the negativity out there, especially with the pain in Europe, and the political scene in the US leading to a Presidential election, I am not that optimistic. The Elliott wave count of the S&P 100 is suggesting a move into a wave V that will be flat. After a wave V could come an ABC correction, which could be long and complicated, ending with the November Presidential election of 2012. A tough year ahead. Hope I am wrong. |
Has been a technical analyst since 1969, and has worked as a futures and options trader with First Financial Futures in Johannesburg, South Africa.
| Address: | 3256 West 24th Ave |
| Vancouver, BC | |
| Phone # for sales: | 6042634214 |
| E-mail address: | petroosp@gmail.com |
Click here for more information about our publications!
Comments
Date: 08/06/11Rank: Comment: I thought leg III could not be shorter than leg I. I thought it was usually larger or at least the same size.
Date: 08/09/11Rank: 5Comment: On August 9, Tuesday in the a.m. this hit my in box.
Blessings,
Dick

Request Information From Our Sponsors
- StockCharts.com, Inc.
- Candle Patterns
- Candlestick Charting Explained
- Intermarket Technical Analysis
- John Murphy on Chart Analysis
- John Murphy's Chart Pattern Recognition
- John Murphy's Market Message
- MurphyExplainsMarketAnalysis-Intermarket Analysis
- MurphyExplainsMarketAnalysis-Visual Analysis
- StockCharts.com
- Technical Analysis of the Financial Markets
- The Visual Investor
- VectorVest, Inc.
- Executive Premier Workshop
- One-Day Options Course
- OptionsPro
- Retirement Income Workshop
- Sure-Fire Trading Systems (VectorVest, Inc.)
- Trading as a Business Workshop
- VectorVest 7 EOD
- VectorVest 7 RealTime/IntraDay
- VectorVest AutoTester
- VectorVest Educational Services
- VectorVest OnLine
- VectorVest Options Analyzer
- VectorVest ProGraphics v6.0
- VectorVest ProTrader 7
- VectorVest RealTime Derby Tool
- VectorVest Simulator
- VectorVest Variator
- VectorVest Watchdog
